

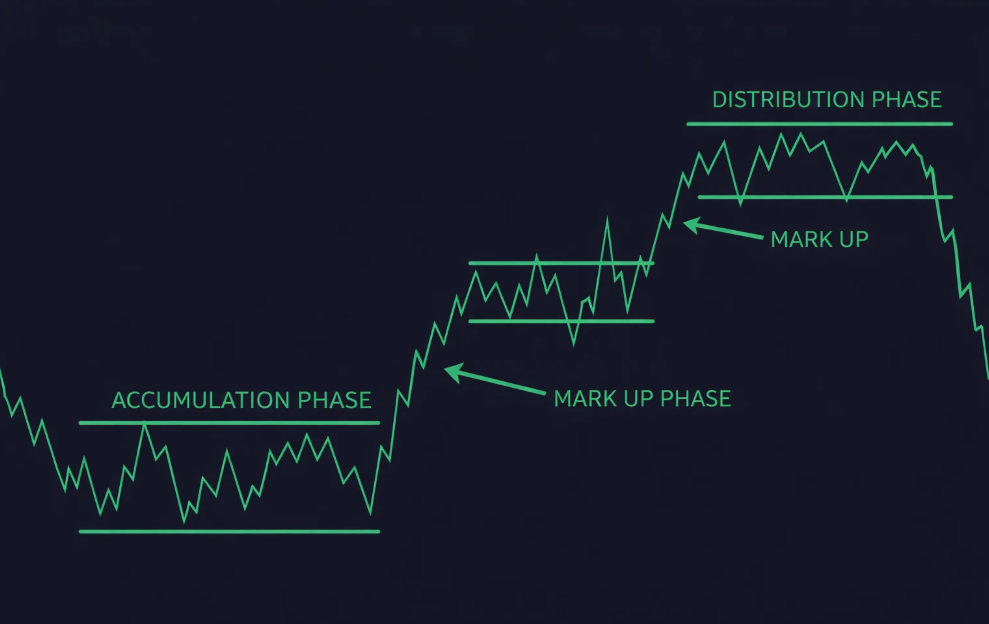
The attached chart illustrates a classic market cycle based on price behavior. The cycle is divided into four major phases: Accumulation, Mark Up, Distribution, and Mark Down. Understanding these phases can help traders identify changing market conditions and avoid entering trades at unfavorable points.
The chart demonstrates how price can move from a period of sideways consolidation into an upward trend, followed by another consolidation phase and eventually a downward move.
1. Accumulation Phase
The Accumulation Phase generally occurs after a significant decline in price. During this period, selling pressure begins to decrease and price starts moving sideways within a defined range.
Instead of making strong directional moves, the market repeatedly moves between support and resistance. This can create the appearance of a weak or inactive market, even though underlying buying interest may be increasing.
- Price generally moves sideways.
- A defined support and resistance range develops.
- Selling pressure may gradually decrease.
- Volatility can contract before a breakout.
- A breakout above the range may signal the beginning of a new uptrend.
What Traders May Watch
Traders may monitor the upper boundary of the accumulation range. A strong breakout followed by sustained price action above resistance can provide evidence that the market is entering a new bullish phase.
2. Mark Up Phase
The Mark Up Phase begins when price successfully breaks out of the accumulation range and starts forming a sequence of higher highs and higher lows.
This is the phase where the market develops a clear upward trend. Buyers become more aggressive, and positive market sentiment can attract additional participants.
- Price breaks above the previous trading range.
- Higher highs and higher lows begin to form.
- Buying momentum increases.
- Pullbacks may provide opportunities to join the prevailing trend.
- Resistance levels can gradually become new support areas.
The chart shows the Mark Up Phase as a series of upward movements interrupted by short periods of consolidation. These pauses can occur as traders take profits while new buyers enter the market.
3. Distribution Phase
After a prolonged advance, the market may enter the Distribution Phase. During this stage, price can stop making consistent higher highs and begin moving sideways near the upper end of the trend.
The chart illustrates this phase as a broad sideways range following the strong Mark Up Phase.
- Price begins moving sideways after a strong rally.
- Repeated attempts to move higher may fail.
- Volatility can increase around important resistance.
- Momentum may gradually weaken.
- A breakdown below important support can signal increasing downside risk.
Why Distribution Matters
Distribution is important because it can indicate that the market is transitioning from an uptrend into a potential downtrend. However, sideways movement by itself does not guarantee a reversal.
Traders should wait for confirmation such as a decisive support breakdown, changes in market structure, or additional technical signals before assuming that a major downtrend has begun.
4. Mark Down Phase
The Mark Down Phase occurs when selling pressure becomes strong enough to push price below the distribution range and establish a declining trend.
In this phase, price typically begins creating lower highs and lower lows. Sellers gain control and previous support zones can become resistance during subsequent rebounds.
- Price breaks below the distribution range.
- Lower highs and lower lows begin to develop.
- Selling momentum increases.
- Previous support levels may become resistance.
- The market may eventually reach another accumulation area.
The Complete Market Cycle
- Accumulation: Price consolidates after a decline.
- Mark Up: Buyers gain control and price begins trending higher.
- Distribution: Price consolidates after an extended rally.
- Mark Down: Sellers gain control and price begins trending lower.
Accumulation → Mark Up → Distribution → Mark Down represents a simplified market-cycle framework. Real markets do not always follow this sequence perfectly, so confirmation from price action and risk management remains important.
How Traders Can Use the Market Cycle
The purpose of identifying market phases is not to predict every market movement. Instead, traders can use the framework to understand the broader market structure and prevailing conditions.
- During Accumulation, traders may monitor potential breakout opportunities.
- During Mark Up, traders may focus on buying opportunities during controlled pullbacks.
- During Distribution, traders may become more cautious about chasing long positions.
- During Mark Down, traders may monitor lower highs, breakdowns and bearish continuation setups.
Key Takeaway
The chart provides a simple visual representation of how market conditions can transition from sideways accumulation to a bullish Mark Up, followed by distribution and eventually a bearish Mark Down.
Recognizing these phases can help traders understand whether the market is consolidating, trending upward, potentially topping out, or trending downward. However, no market-cycle model should be used in isolation.
Price action, volume, support and resistance, trend structure, momentum indicators and appropriate risk management should be considered before making any trading decision.
Conclusion
The four phases shown in the chart provide a useful framework for understanding market psychology. The cycle begins with Accumulation, develops into Mark Up, transitions into Distribution, and can eventually move into Mark Down.
By learning to recognize these stages, traders can develop a better understanding of the relationship between price consolidation, breakouts, trends and reversals.
Disclaimer: This content is provided for educational and informational purposes only and does not constitute financial, investment or trading advice. Market behavior is unpredictable, and no market-cycle pattern guarantees a particular future price movement. Trading financial instruments involves significant risk of loss. Always conduct your own research and use appropriate risk management.
Comments (0)
No comments yet. Be the first to comment.