

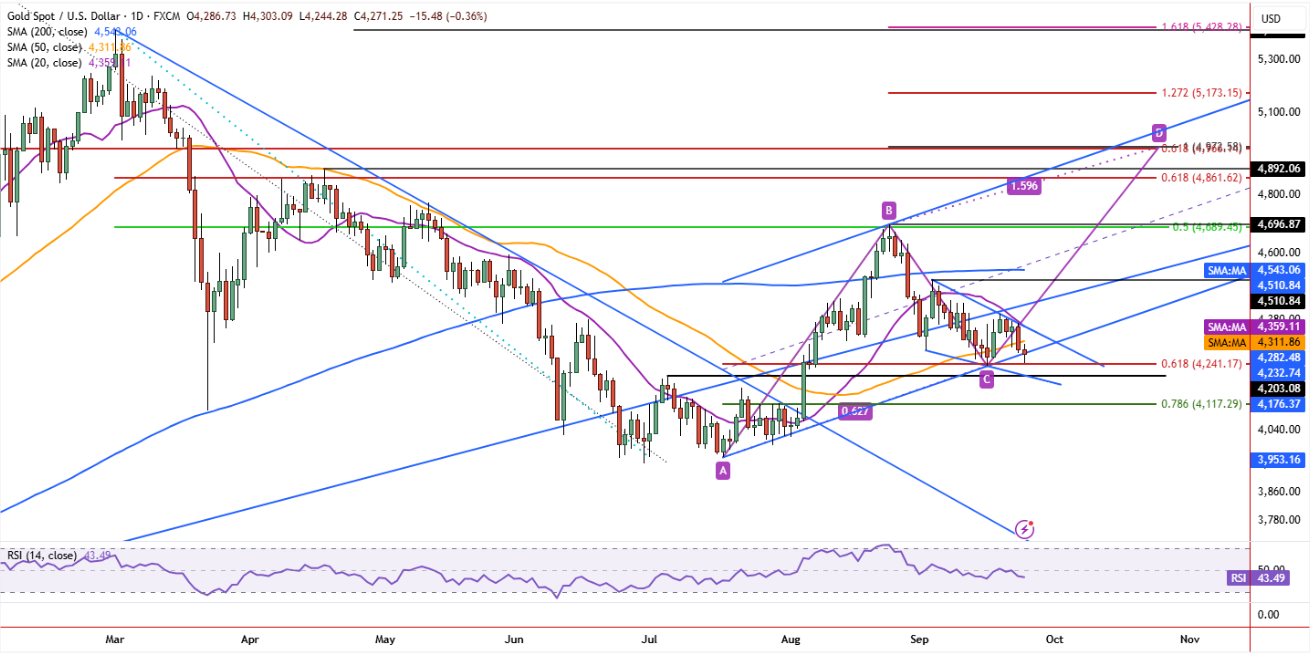
The attached chart shows the Gold Spot / U.S. Dollar (XAU/USD) on the daily timeframe. Gold is currently trading around 4,271, following a recent pullback from the September high near the 4,700 area.
The chart combines 20-day, 50-day and 200-day moving averages, Fibonacci retracement and extension levels, trendlines, and the RSI (14) to identify important areas that traders may monitor.
Current Gold Price Structure
Gold recently rallied strongly from the July low and reached an important swing high around 4,700. Since then, the market has entered a corrective phase and is currently trading below several short-term moving averages.
The current price shown on the chart is approximately 4,271.25. The price is below the 20-day SMA near 4,359 and the 50-day SMA near 4,312, indicating that short-term momentum has weakened relative to the previous rally.
Important Support Levels
- 4,241: A key Fibonacci support level highlighted on the chart.
- 4,117: The next important Fibonacci support area if selling pressure continues.
- 4,040–3,953: A broader support region formed around previous price action and trendline structure.
The 4,241 area is particularly important in the near term. Holding this region could allow gold to stabilize and attempt another recovery, while a decisive breakdown could expose the lower support zones.
Important Resistance Levels
- 4,312: Approximate 50-day SMA and an immediate reference level.
- 4,359: Approximate 20-day SMA and short-term resistance.
- 4,510–4,545: Major moving-average and trendline resistance area.
- 4,697: Important Fibonacci resistance and previous swing area.
- 4,862: Higher Fibonacci resistance level.
Moving Average Analysis
The chart shows the following major moving averages:
- 20-day SMA: Approximately 4,359
- 50-day SMA: Approximately 4,312
- 200-day SMA: Approximately 4,545
Gold is currently trading below the 20-day and 50-day averages and also below the 200-day average shown on the chart. This structure indicates that the market is undergoing a correction after the previous advance.
For a stronger recovery, traders may watch whether price can reclaim the 4,312–4,359 region first, followed by the 4,510–4,545 area.
Fibonacci Levels
The Fibonacci structure on the chart provides several reference points for both support and resistance.
- 0.618 resistance: Approximately 4,862
- 0.500 level: Approximately 4,697
- 0.618 support: Approximately 4,241
- 0.786 support: Approximately 4,117
- 1.272 extension: Approximately 5,173
- 1.618 extension: Approximately 5,428
RSI Analysis
The RSI (14) is shown around 43.49. This is below the neutral 50 level but above the traditional oversold region near 30. Therefore, the RSI currently reflects relatively weaker momentum without indicating an oversold condition.
A move back above the 50 RSI area could indicate improving momentum, while a continued decline toward 30 would indicate increasing downside momentum.
Possible Market Scenarios
- Support Holds: If gold holds the 4,241 area and buyers regain control, price could attempt a recovery toward 4,312–4,359 and potentially the higher resistance zones.
- Resistance Breakout: A sustained move above the 4,359 region could improve the short-term structure and bring the 4,510–4,545 area into focus.
- Support Breakdown: A decisive break below 4,241 could increase the possibility of a deeper correction toward approximately 4,117 and potentially lower support areas.
Key Levels at a Glance
- Current price: ~4,271
- Immediate support: 4,241
- Major support: 4,117
- Immediate resistance: 4,312–4,359
- Major resistance: 4,510–4,545
- Higher resistance: 4,697–4,862
- RSI: ~43.49
Gold is currently in a corrective phase after its previous rally. The 4,241 support zone and the 4,312–4,359 resistance zone are important short-term reference areas for monitoring the next directional move.
Conclusion
The daily chart shows that gold has pulled back from the recent 4,700 region and is currently trading around 4,271. Price remains below the 20-day, 50-day and 200-day moving averages shown on the chart, while the RSI is below the 50 level.
The immediate technical focus is therefore the 4,241 support area. If this level holds, the market may attempt to recover toward 4,312–4,359. A stronger recovery above this zone could shift attention toward 4,510–4,545 and higher resistance levels.
On the other hand, a decisive move below 4,241 could expose the next support near 4,117. Traders may therefore monitor price action around these levels rather than relying on a single indicator.
Disclaimer: This technical analysis is provided for educational and informational purposes only and should not be considered financial, investment or trading advice. Gold prices can be highly volatile and may be affected by interest rates, inflation data, central-bank policy, geopolitical events, currency movements and broader market sentiment. Futures and CFD trading involves substantial risk of loss. Always conduct your own research and use appropriate risk management.
Comments (0)
No comments yet. Be the first to comment.