

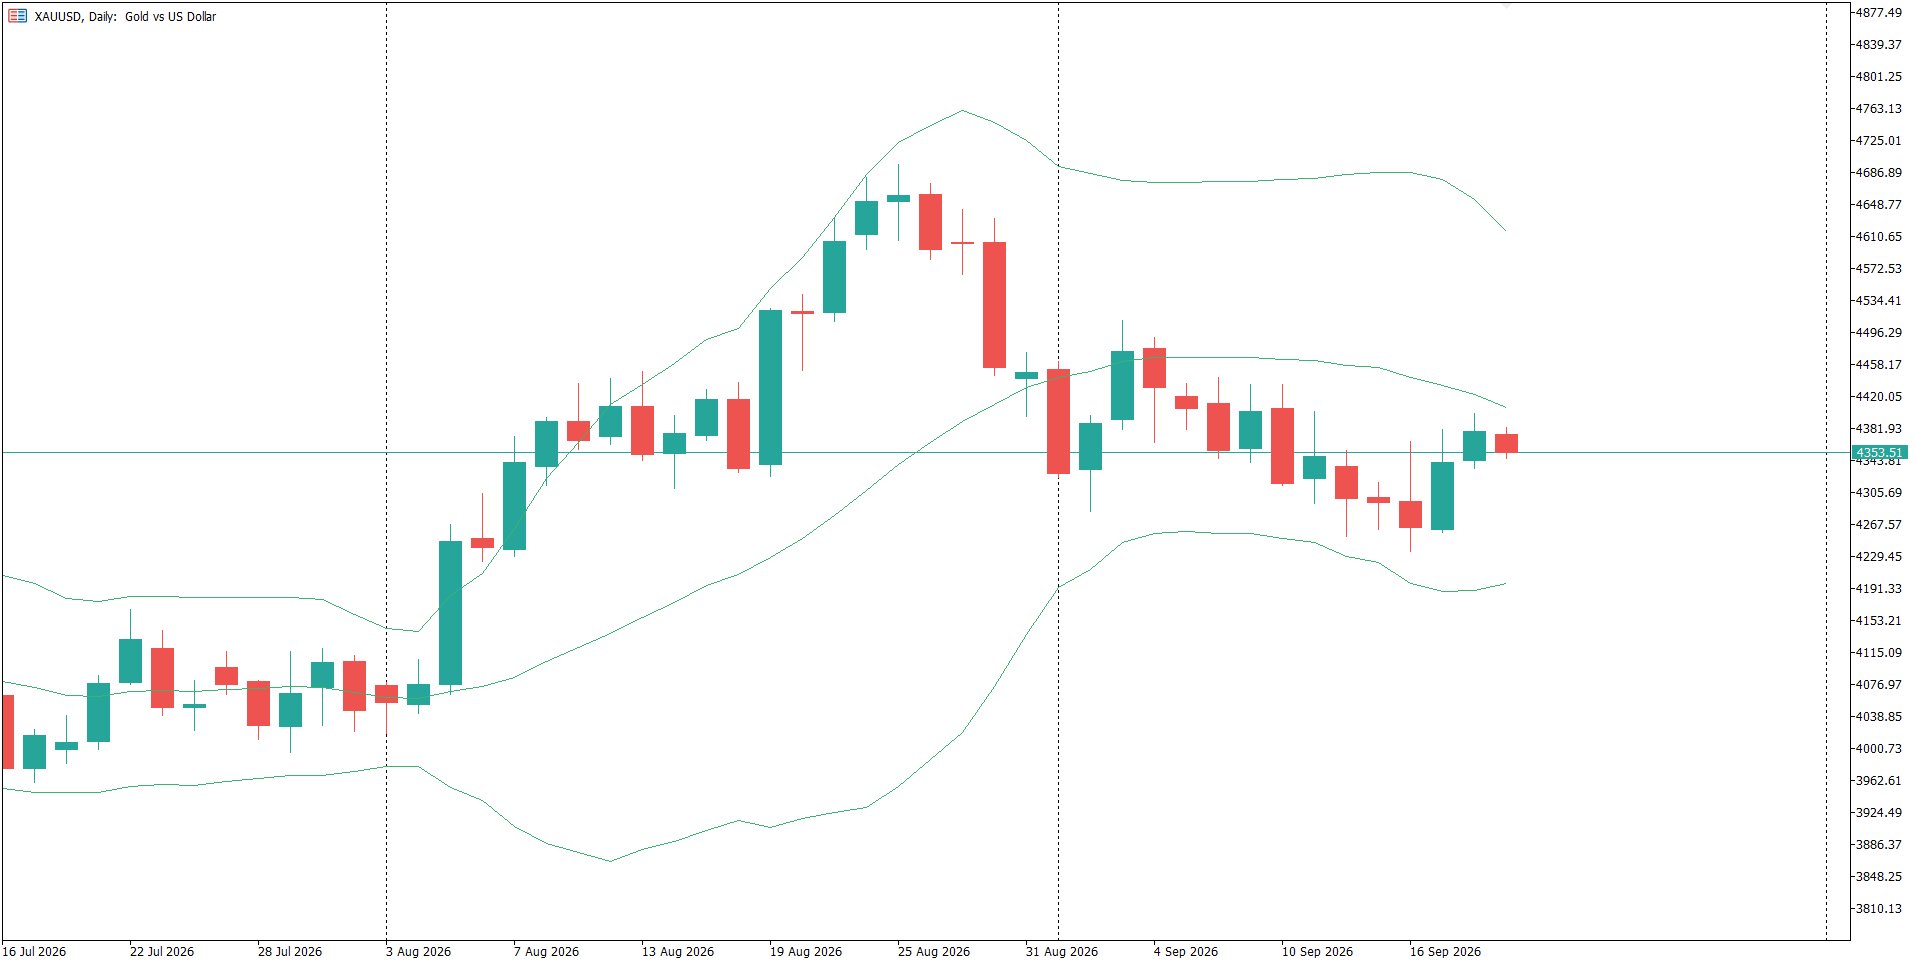
At the time shown on the chart, gold is trading around 4,385.97. After reaching the approximately 4,700 region, price experienced a correction and moved back toward the 4,300–4,400 area.
Key Technical Levels
- Current price: Around 4,385.97
- Immediate resistance: Approximately 4,450–4,500
- Major resistance: Around 4,650–4,700
- Immediate support: Around 4,300–4,350
- Lower support zone: Approximately 4,000–4,100
Recent Price Action
The daily chart shows a strong historical advance from the lower 3,800–4,000 region toward substantially higher levels. The market subsequently reached the 5,000+ area before entering a prolonged declining phase.
More recently, gold formed a recovery from around the 4,000 region and rallied toward approximately 4,700. This advance was followed by a pullback, bringing price back toward the current 4,300–4,400 zone.
Current Market Structure
The latest candles suggest that gold is currently moving within a relatively tight range after the recent correction. The area around 4,300–4,350 is important because buyers have previously appeared around this region.
On the upside, the 4,450–4,500 area can be monitored as an initial resistance region. A stronger recovery could bring the previous 4,650–4,700 high into focus.
Important Scenarios to Monitor
- A sustained move above 4,450–4,500 could indicate renewed upward momentum and place the previous high near 4,700 back in focus.
- Continued trading below the resistance area could keep gold in a consolidation phase.
- A decisive breakdown below the 4,300 region could increase attention toward the lower support areas.
Daily-chart analysis should be combined with lower-timeframe price action, volume, volatility and risk management before making any trading decision.
Conclusion
The gold daily chart currently shows a market recovering from a significant decline but consolidating after its recent rally. The 4,300–4,350 support zone and the 4,450–4,500 resistance zone are useful reference areas for monitoring the next price movement.
Disclaimer: This analysis is for educational and informational purposes only and does not constitute financial or investment advice. Gold futures and CFDs involve substantial risk. Market prices can change rapidly due to interest rates, inflation data, central-bank policy, geopolitical events, currency movements and market sentiment. Always perform your own analysis and manage risk appropriately.
Comments (0)
No comments yet. Be the first to comment.