

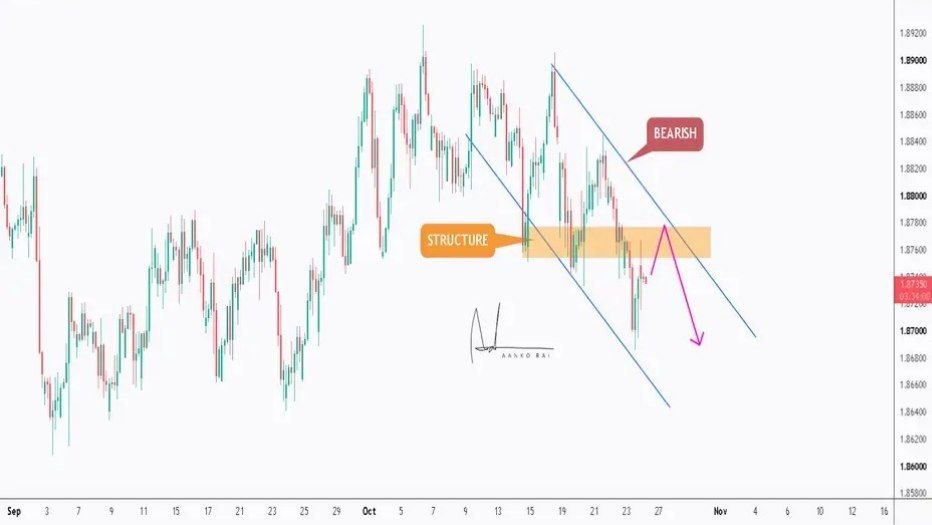
The GBPCAD currency pair on the 4-hour (H4) timeframe continues to show a bearish technical structure, with price moving within a descending channel. The latest price action indicates a recovery toward an important structure zone, where sellers may attempt to regain control.
Although price is recovering in the short term, the broader structure shown in the chart remains bearish while the descending channel and lower-high formation remain intact.
Technical Market Structure
The chart highlights a descending channel formed by two downward-sloping trendlines. Price has been moving between these boundaries, indicating that selling pressure remains present.
- Trend direction: Bearish while the descending structure remains intact.
- Timeframe: 4-hour (H4).
- Key area: The highlighted structure zone near the recent price action.
- Potential resistance: The structure zone and descending trendline.
- Bearish confirmation: Rejection followed by renewed selling pressure and a break below nearby support.
Key Structure Zone
The orange-highlighted area represents an important price structure zone. This region may act as resistance if price approaches it from below and sellers defend the area.
Traders can monitor how price behaves inside this zone. A bearish rejection, such as a failure to sustain a breakout or the formation of a lower high, could provide additional evidence that sellers remain in control.
However, if price breaks above the zone and holds there, the bearish setup may weaken. Confirmation is therefore more important than simply touching the zone.
Potential Bearish Trading Scenario
- Wait for a retracement: Allow price to approach the highlighted structure zone rather than chasing the market after a downward move.
- Look for rejection: Monitor H4 candle closes and price action for evidence that buyers are failing to sustain the recovery.
- Seek bearish confirmation: A lower high or a renewed move below nearby support may strengthen the bearish scenario.
- Plan risk management: Define a stop-loss above the relevant swing high or invalidation level before considering an entry.
- Monitor downside targets: Potential targets may include the previous swing low and the lower boundary of the descending channel.
What Could Invalidate the Bearish View?
The bearish outlook would become weaker if price breaks above the highlighted structure zone and establishes sustained trading above the descending channel. A confirmed higher high or a successful retest of broken resistance as support could suggest a shift in market structure.
Traders should avoid assuming that every recovery toward resistance will result in a sell-off. Price may break out of the channel, consolidate, or continue higher.
Conclusion
GBPCAD H4 remains technically bearish in the chart provided, with price recovering toward a key structure zone within a descending channel. A confirmed rejection could present a potential bearish continuation setup, while a sustained breakout above resistance would require reassessing the outlook.
Trading takeaway: Wait for price to reach the structure zone, look for bearish confirmation, and define the invalidation level before considering a trade. Patience and disciplined risk management are essential.
Disclaimer: This chart analysis is for educational and informational purposes only and does not constitute financial or investment advice. Forex trading involves substantial risk and may not be suitable for all traders. The scenarios described are conditional, not guaranteed outcomes. Always conduct your own research and apply appropriate risk management.
```
Comments (0)
No comments yet. Be the first to comment.