

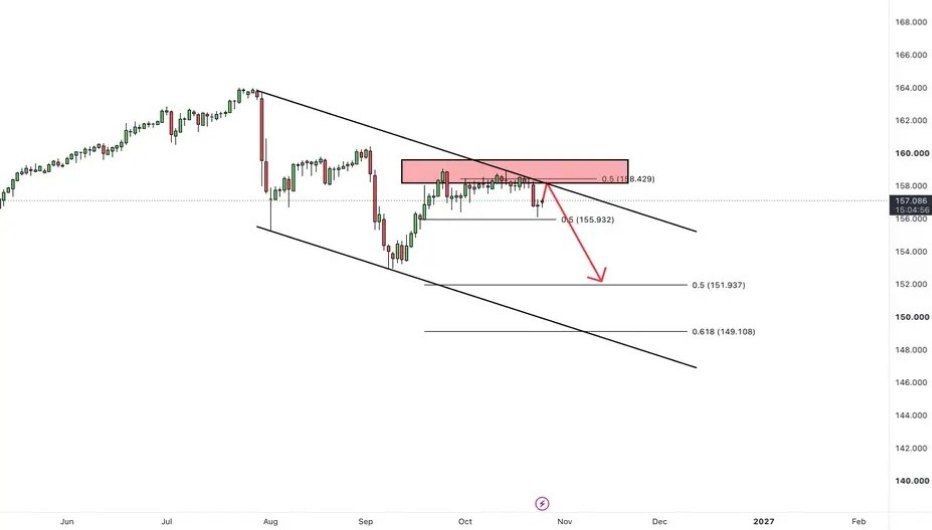
The USDJPY currency pair continues to trade within a descending channel on the daily timeframe. The technical structure shown in the chart suggests that bearish pressure may persist, with price approaching a major resistance zone near the upper boundary of the channel.
The highlighted resistance area between 158.20 and 159.60 represents an important zone to monitor. The confluence of descending trendline resistance and the horizontal supply area could make this region significant for the next directional move.
Current Market Structure
The chart shows that USDJPY experienced a significant decline from its previous high, followed by a recovery toward the upper boundary of the descending channel. Despite this rebound, the broader structure remains bearish while price continues to form lower highs and remains below the descending trendline.
- Currency pair: USDJPY (U.S. Dollar / Japanese Yen).
- Timeframe: Daily.
- Market bias: Bearish while price remains below key resistance.
- Major resistance zone: 158.20–159.60.
- Bearish confirmation level: 155.93.
- Potential downside target: 151.94.
Key Resistance Zone: 158.20–159.60
The highlighted area between 158.20 and 159.60 is the primary resistance zone in this technical setup. Price is approaching this area while the descending trendline adds another layer of potential resistance.
If price enters this zone and fails to sustain a breakout, sellers may regain control. A bearish rejection candle, a lower high, or renewed downward momentum could provide additional confirmation of a possible continuation move.
However, resistance alone does not guarantee a reversal. Traders should monitor the price reaction and wait for confirmation rather than assuming that the market will decline immediately.
Bearish Continuation Level: 155.93
The 155.93 level is an important downside confirmation point marked on the chart. A decisive break below this area could indicate that selling pressure is strengthening and that the market may be preparing for another downward leg.
Traders may look for a daily candle close below this level or a confirmed breakdown followed by a retest. Such price action could strengthen the bearish continuation scenario.
Potential Downside Target: 151.94
If USDJPY breaks below 155.93 and bearish momentum continues, the next projected downside area is approximately 151.94. This level represents a potential objective in the chart's bearish scenario.
The market may encounter intermediate support or experience a temporary rebound before reaching this target. Therefore, traders should reassess price action as the market approaches each significant support area.
Potential Trading Scenarios
- Bearish rejection: If price rejects the 158.20–159.60 resistance zone and bearish momentum returns, the pair could move toward 155.93.
- Breakdown confirmation: A decisive move below 155.93 could strengthen the bearish outlook and bring 151.94 into focus.
- Resistance breakout: If price breaks above 159.60 and sustains trading above the descending trendline, the bearish structure may weaken.
- Consolidation: If price remains between resistance and nearby support without a clear breakout, the pair may continue consolidating within the existing structure.
What Could Invalidate the Bearish Outlook?
The bearish scenario would weaken if USDJPY establishes a sustained breakout above the 158.20–159.60 resistance zone and the descending channel's upper boundary.
A confirmed breakout followed by a successful retest could indicate a shift in market structure and open the possibility of a deeper corrective recovery. Traders should therefore remain flexible and reassess the setup if price behavior contradicts the original bearish thesis.
Key Levels at a Glance
- Major resistance: 158.20–159.60.
- Bearish confirmation: Below 155.93.
- Potential downside target: 151.94.
- Trend structure: Descending channel on the daily timeframe.
- Bearish invalidation signal: Sustained breakout above resistance and channel trendline.
Trading takeaway: USDJPY remains technically bearish while price stays below the descending channel's upper boundary and the 158.20–159.60 resistance zone. A confirmed rejection may support a bearish continuation scenario, while a decisive break below 155.93 could expose the 151.94 area.
Conclusion
USDJPY is approaching a major resistance area that overlaps with the upper boundary of its descending channel. The price reaction around 158.20–159.60 will be important in determining whether the existing bearish structure remains intact.
A confirmed rejection followed by a breakdown below 155.93 could strengthen the case for a move toward 151.94. Conversely, a sustained breakout above the resistance zone and descending trendline would require a reassessment of the bearish outlook.
Disclaimer: This analysis is for educational and informational purposes only and does not constitute financial or investment advice. Forex markets are volatile, and technical patterns do not guarantee future price movements. Always conduct your own research, use appropriate position sizing, and apply disciplined risk management.
Comments (0)
No comments yet. Be the first to comment.