

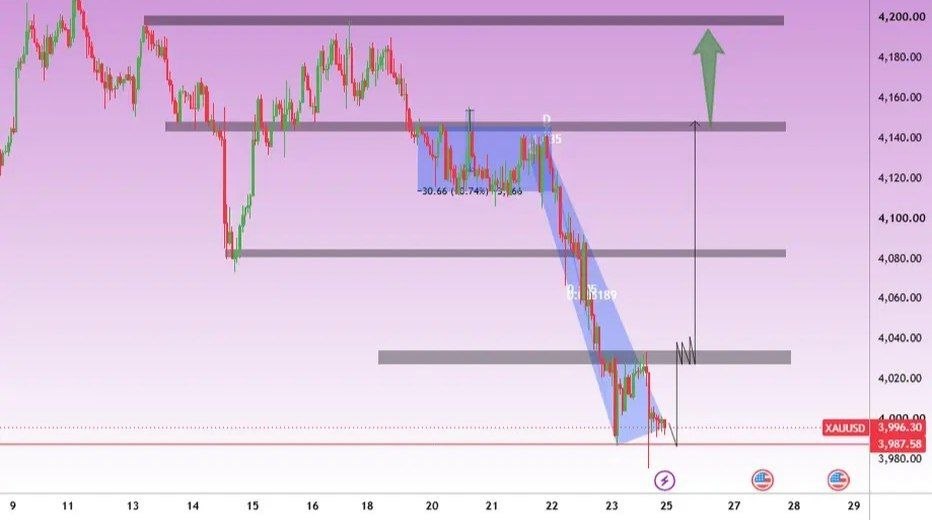
This XAUUSD (Gold vs. US Dollar) technical analysis examines the current market structure using liquidity concepts, price action, and Inner Circle Trader (ICT) trading principles. Following a strong bearish move, gold has reached an important liquidity area around 3,982.915, where a potential bullish reaction may develop.
The chart suggests that price has moved below previous weekly and daily candle lows, potentially triggering sell-side liquidity. If buyers regain control and bullish confirmation appears, gold could recover toward the 4,090.840 area, identified as a potential four-hour (4H) point of interest (POI).
If price reaches the 4H POI and continues higher, the previous-day high near 4,193.235 becomes a possible upside objective. However, this scenario remains conditional on price action and confirmation.
Market Overview
Gold has recently experienced strong selling pressure, moving downward through several support areas. The chart highlights a sharp bearish impulse toward the 3,982.915 region, where previous lows may have provided liquidity for the market to target.
In liquidity-based trading, previous highs and lows are monitored because stop orders and breakout orders may cluster around these levels. A move below previous lows followed by a strong recovery can sometimes indicate a liquidity sweep, but the sweep alone does not confirm a bullish reversal.
Key Liquidity Area: 3,982.915
The 3,982.915 area is the key downside reference identified in this analysis. Price has approached or moved through the region associated with previous weekly and daily lows.
- Key area: Around 3,982.915.
- Liquidity concept: Potential sell-side liquidity sweep.
- What to watch: Whether price reclaims the level and forms bullish structure.
- Bullish confirmation: A strong upward displacement or a break of a relevant lower-timeframe swing high.
If price reclaims the swept-low area and begins forming higher highs and higher lows, the possibility of a short-term recovery may improve. If price continues trading below the lows with strong bearish momentum, the bullish scenario would need to be reassessed.
First Potential Upside Target: 4,090.840
The 4,090.840 region is identified as a potential 4H point of interest (POI). After the recent decline, this area may act as a price reaction zone and could become a recovery target if buyers establish control.
Traders can monitor lower-timeframe price action for bullish displacement, a market structure shift, or a successful retest before considering whether a move toward this region is developing.
The 4H POI should not automatically be treated as a guaranteed target. Price may encounter resistance before reaching it, or the market may continue lower without a meaningful retracement.
Next Potential Target: 4,193.235
If gold reaches the 4,090.840 area and continues to demonstrate bullish momentum, the previous-day high near 4,193.235 becomes a potential secondary upside objective.
Previous highs can attract attention because liquidity may accumulate above them. Nevertheless, price must first show sufficient strength to move through intermediate resistance and sustain the recovery.
Possible Market Scenarios
- Bullish recovery: Price reclaims the liquidity-sweep area, forms bullish market structure, and moves toward 4,090.840.
- Extended bullish continuation: If price moves through the 4H POI with sustained momentum, the previous-day high near 4,193.235 may become the next area of interest.
- Bearish continuation: If price fails to reclaim the swept-low area and continues making lower lows, the expected bullish recovery may not develop.
- Resistance reaction: Price may reach the 4H POI but encounter selling pressure and reverse before reaching the higher target.
What Traders Should Monitor
- Price reaction around the 3,982.915 liquidity area.
- A confirmed lower-timeframe bullish market structure shift.
- Whether price can move toward the 4,090.840 4H POI.
- Rejection or continuation behavior around the 4H POI.
- Potential movement toward the previous-day high at 4,193.235.
- Risk management if price continues below the recent lows.
Trading takeaway: Gold may be developing a potential bullish recovery after targeting liquidity around 3,982.915. If bullish price-action confirmation appears, 4,090.840 is the first area to monitor, followed by 4,193.235 if upward momentum continues. The setup remains conditional, and continued bearish price action could invalidate the scenario.
Conclusion
The XAUUSD chart shows a strong bearish move toward a region associated with previous weekly and daily lows. From a liquidity-based perspective, this may create the conditions for a short-term recovery if buyers regain control and confirm a bullish shift in market structure.
The main levels to monitor are 3,982.915 as the key liquidity reference, 4,090.840 as the potential 4H POI, and 4,193.235 as the potential higher target. Confirmation from price action remains essential before drawing conclusions about the next market direction.
Disclaimer: This analysis is for educational and informational purposes only and does not constitute financial, investment, or trading advice. Gold prices can be volatile, and liquidity sweeps, market structure shifts, and projected targets do not guarantee future price movements. Always conduct your own research and apply appropriate risk management.
```
Comments (0)
No comments yet. Be the first to comment.