

Key Technical Levels
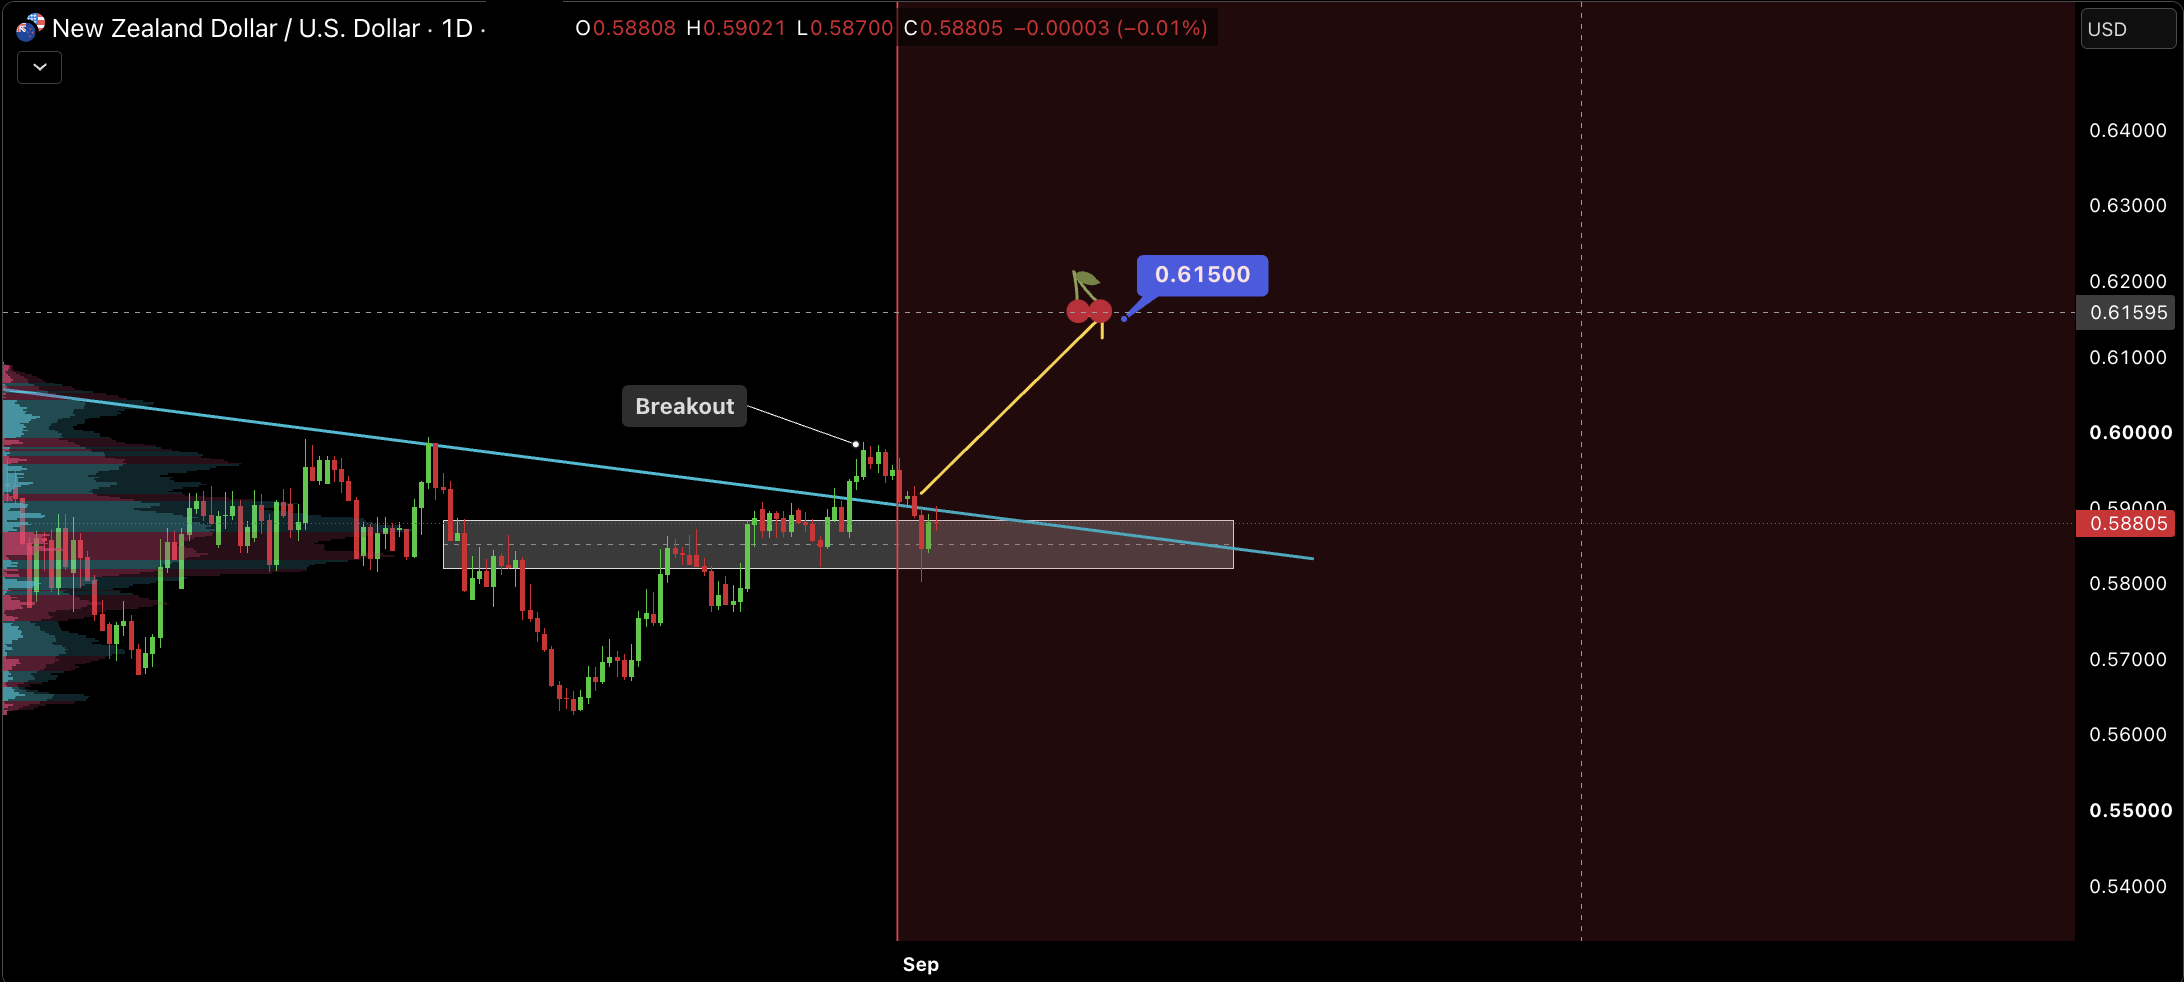
- Current price reference: Around 0.58805
- Breakout area: Approximately 0.59000–0.60000
- Previous consolidation zone: Approximately 0.58000–0.59000
- Projected upside target: 0.61500
- Important trendline: Previously descending resistance line
Breakout Structure
NZD/USD had been trading beneath a descending trendline for an extended period. The chart shows price pushing above this trendline, creating a potential bullish breakout structure.
The breakout is particularly important because the pair had previously struggled to move above the descending resistance. A successful hold above the breakout region could encourage further buying interest.
Potential Bullish Scenario
- NZD/USD holds above the broken descending trendline.
- Price successfully retests the breakout region as support.
- Buyers maintain control above the consolidation zone.
- Bullish momentum could extend toward 0.60000.
- A sustained move higher could open the path toward the projected 0.61500 target.
Key idea: The breakout above the descending trendline changes the technical picture from prolonged consolidation toward a potentially bullish continuation scenario.
0.60000 Psychological Level
The 0.60000 level is an important psychological price area. A strong move above this level could strengthen the bullish outlook, while rejection could result in another consolidation or retest of the breakout zone.
Projected Target: 0.61500
The chart identifies 0.61500 as the projected upside target. Reaching this level would require continued bullish momentum and successful clearance of the intermediate resistance areas.
What Could Invalidate the Bullish Setup?
A sustained move back below the broken descending trendline could signal a failed breakout. Traders should therefore watch the breakout area carefully and wait for confirmation before assuming that the projected move will occur.
Disclaimer
Disclaimer: This technical analysis is provided for educational and informational purposes only and is not financial or investment advice. Forex trading carries substantial risk, and market conditions can change rapidly. The levels and projections shown are based on the attached chart and should not be treated as guaranteed targets.
Always perform your own analysis and apply appropriate risk management before making any trading decision.
Comments (0)
No comments yet. Be the first to comment.