

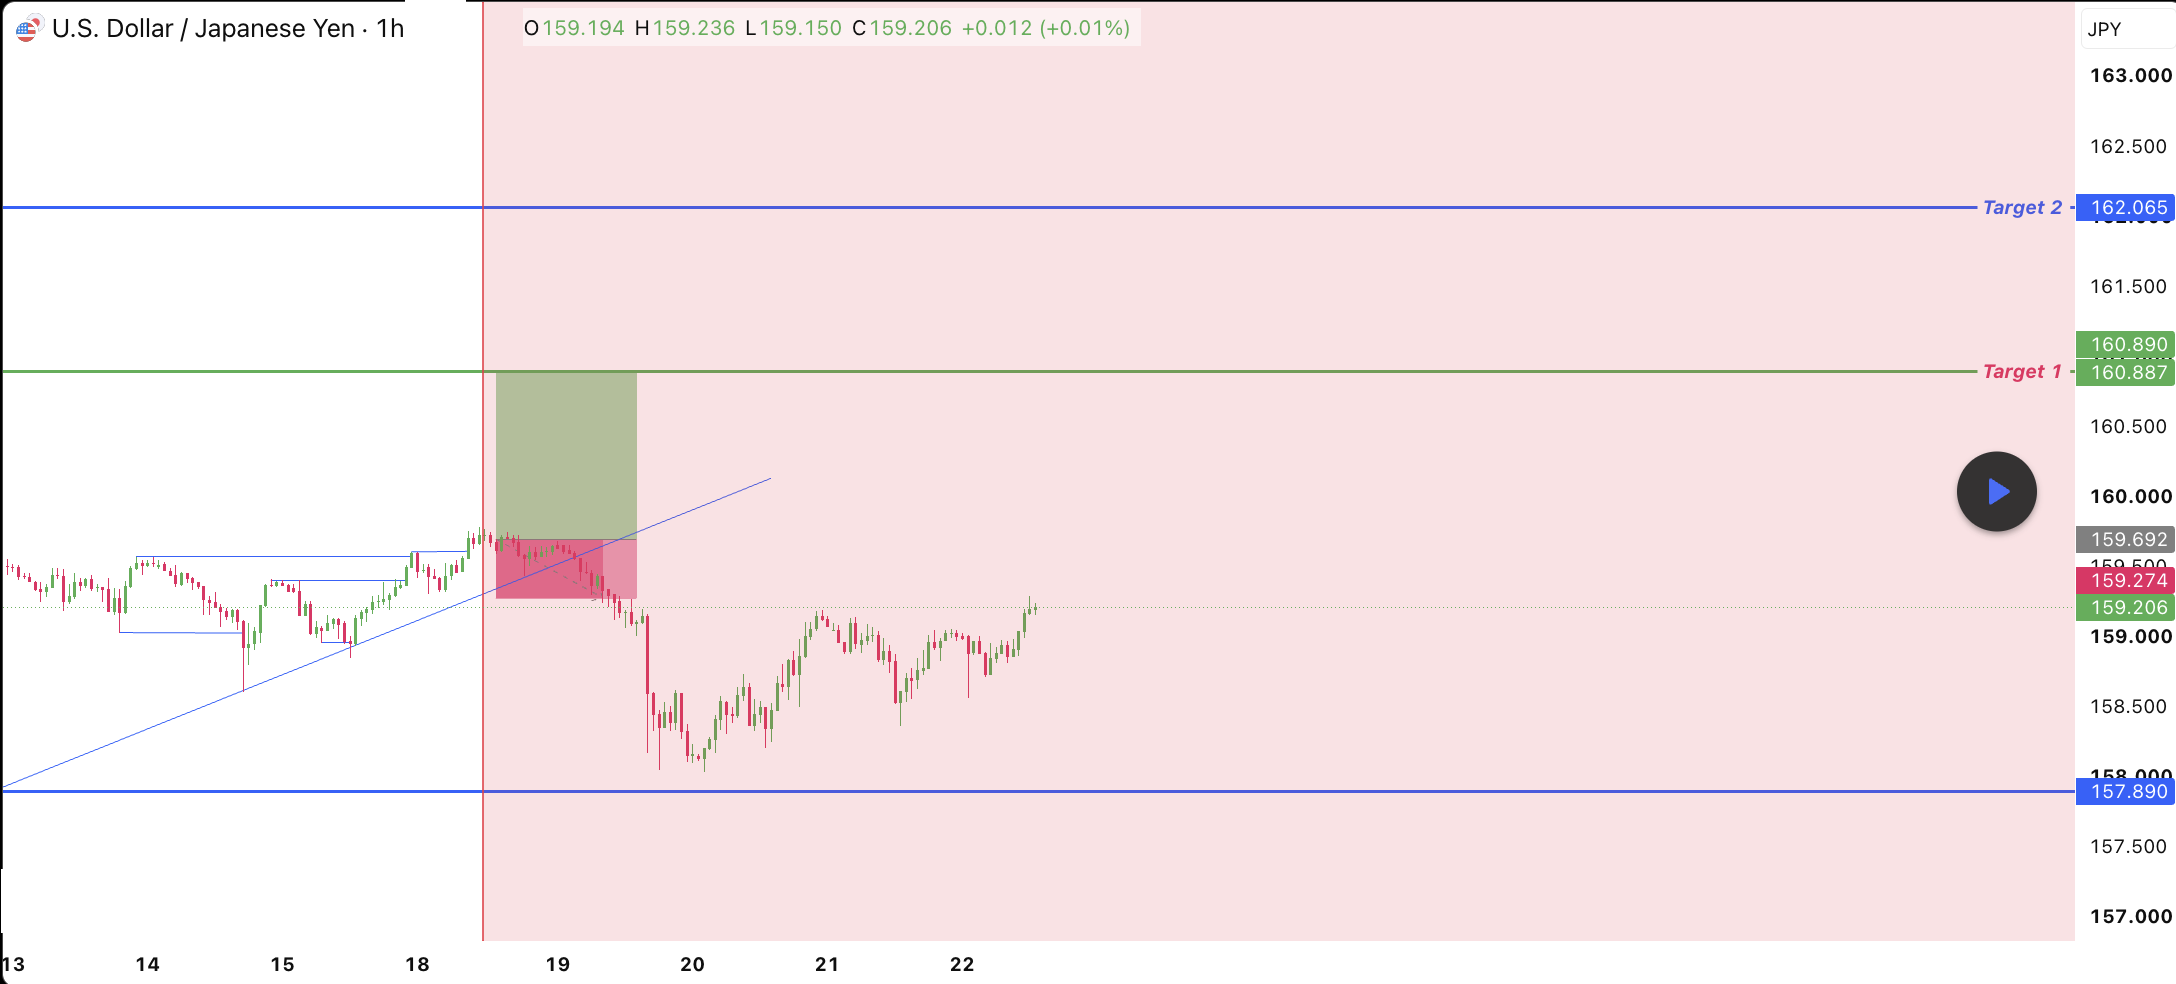
Key Technical Levels
- Current price reference: Around 159.206
- Key support: 157.890
- Target 1: 160.890
- Target 2: 162.065
- Intermediate resistance: Around 159.600–160.000
Market Structure
USD/JPY previously developed a short-term upward structure before experiencing a sharp pullback. After reaching the lower area near 158.00, the pair began recovering and has since been forming a series of higher short-term price movements.
The chart suggests that continued buying pressure could potentially drive USD/JPY toward the first target at 160.890, with the second target located near 162.065.
Potential Bullish Scenario
- USD/JPY maintains support above the major 157.890 level.
- Price continues to form higher lows on the 1-hour timeframe.
- The pair breaks through the 159.60–160.00 resistance region.
- The first upside objective becomes 160.890.
- If bullish momentum remains strong, the next projected target is 162.065.
Key idea: Holding above the major 157.890 support level keeps the bullish recovery scenario technically relevant, while a sustained breakdown below support would weaken the setup.
Target 1: 160.890
The first projected target is positioned at 160.890. This level could act as an important resistance area and may be used by traders as a potential profit-taking reference.
Target 2: 162.065
If USD/JPY successfully clears the first target with strong momentum, the chart projects a further move toward 162.065. Traders should monitor price action around the first target before expecting continuation toward the second objective.
Risk Management and Disclaimer
Disclaimer: This analysis is for educational and informational purposes only and does not constitute financial advice. Forex trading involves substantial risk. The projected targets and support levels are based solely on the attached technical chart and are not guaranteed outcomes.
Always manage risk carefully and consider market volatility, economic news and changing price action before taking any position.
Comments (0)
No comments yet. Be the first to comment.