

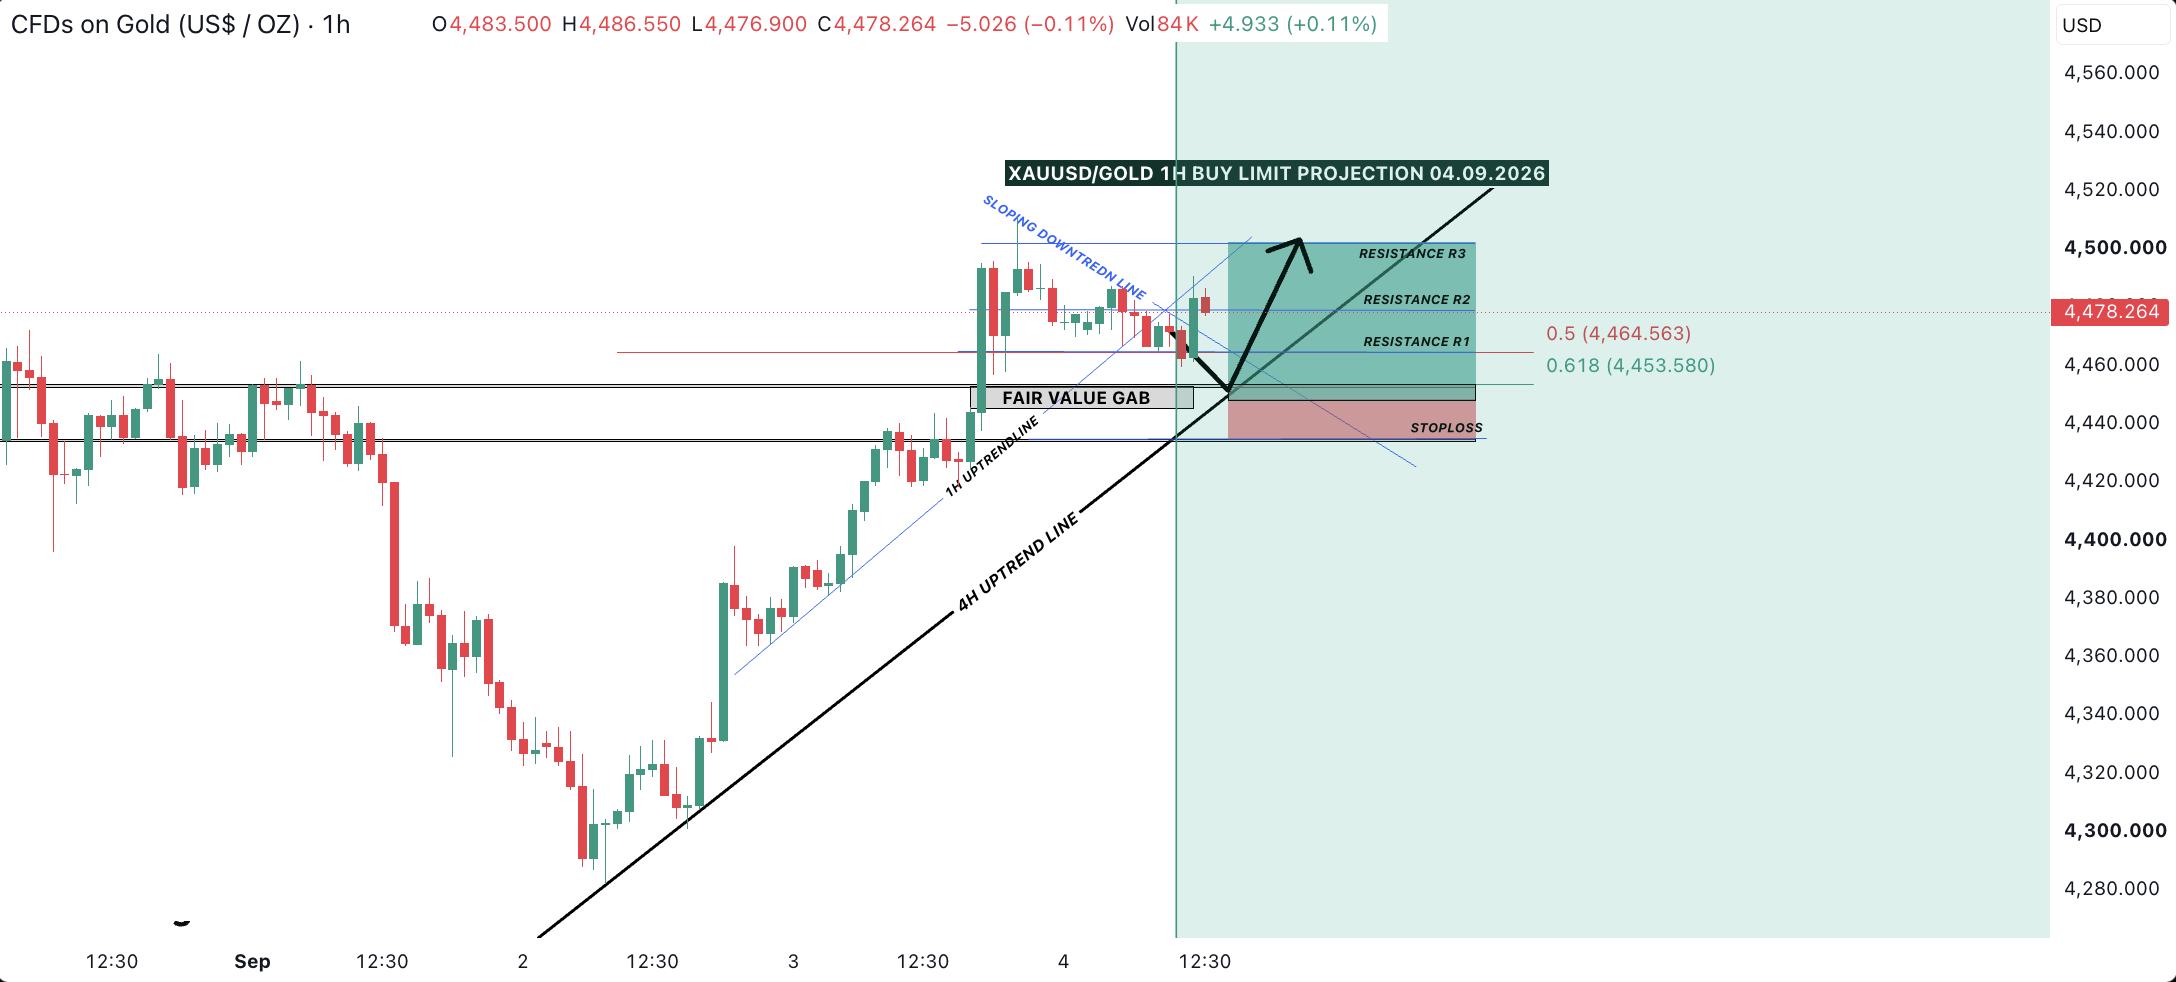
The Gold (XAU/USD) 1-hour chart shows a potential bullish setup following a strong recovery from the recent lower levels. Price has been moving higher along the 4-hour and 1-hour uptrend structures, while the current pullback is approaching an area of technical interest.
Key Technical Levels
- 0.5 Fibonacci level: 4,464.563
- 0.618 Fibonacci level: 4,453.580
- Resistance R1: Around the 4,465–4,480 area
- Resistance R2: Around 4,490–4,500
- Resistance R3: Around 4,500 and above
- Potential stop-loss area: Below the marked support and trend structure
Fair Value Gap and Buy Zone
The chart highlights a Fair Value Gap (FVG) around the 4,450–4,460 region. This area may act as a potential reaction zone if Gold continues to retrace.
The marked Fibonacci levels, particularly 4,464.563 and 4,453.580, provide additional technical confluence. A controlled pullback into this area followed by bullish price action could support the buy-limit scenario shown on the chart.
Potential Bullish Scenario
- Gold retraces toward the highlighted Fibonacci and Fair Value Gap area.
- Buyers defend the support region.
- Price breaks back above the nearby resistance levels.
- Bullish momentum could then extend toward 4,500 and potentially higher levels.
Trading idea: The chart favours looking for a bullish reaction from the marked support/Fibonacci area rather than chasing price after a strong upward move.
What Traders Should Watch
The key confirmation will be how Gold behaves around the 4,453–4,465 region. A strong rejection from this area could strengthen the bullish setup, while a decisive breakdown below the major support structure could invalidate the immediate buy scenario.
Gold Market Outlook
The overall chart structure remains constructive as long as the higher-timeframe uptrend remains intact. However, resistance near the 4,500 area could create selling pressure, so traders should monitor price action carefully before entering a position.
Disclaimer
Disclaimer: This analysis is for educational and informational purposes only and is not financial or investment advice. Gold and CFD trading involve substantial risk. The levels shown are based on the attached chart and may change as market conditions develop. Always use proper risk management and conduct your own analysis before making any trading decision.
Technical levels represent areas of interest and are not guaranteed entry, exit, or profit levels.
Comments (0)
No comments yet. Be the first to comment.