

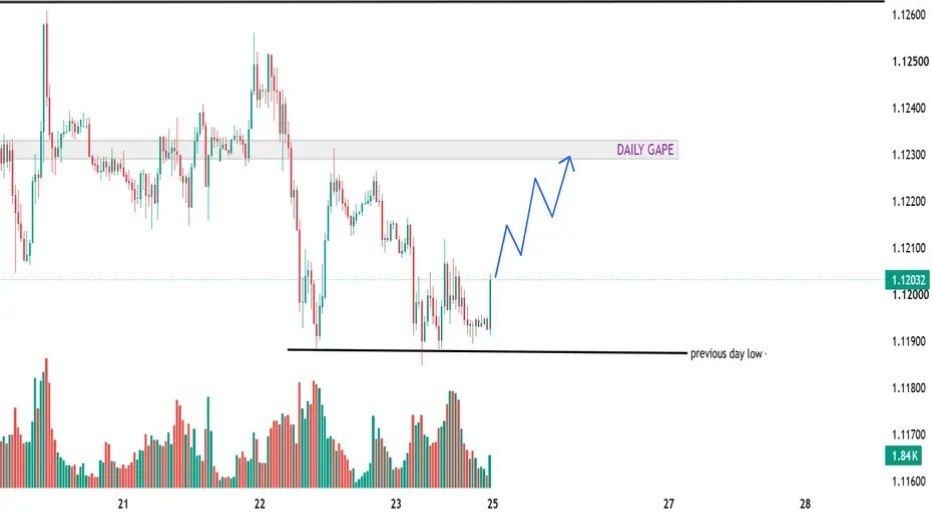
After the initial bullish reaction, price moved upward toward the 1.12120 area. The chart suggests that sellers were unable to maintain downward pressure after the previous day's low was swept, opening the possibility of a further recovery toward the daily gap near 1.12286.
1. Previous Day's Low and Liquidity Sweep
The previous day's low near 1.11890 is an important reference level on the chart. Traders often monitor these levels because stop-loss orders and breakout orders may accumulate around previous highs and lows.
Price moved below or tested this previous low before recovering. This movement may represent a liquidity sweep, particularly if price quickly returns above the level rather than continuing lower.
- Previous day's low: Approximately 1.11890.
- Observed behavior: Price tested the previous-low area and then recovered.
- Potential interpretation: A failed downside continuation and possible bullish reversal.
2. Lower-Timeframe Confirmation
On the 5-minute or 15-minute timeframe, traders can examine how price behaves around the previous day's low. A strong bullish displacement, a break of a nearby lower-timeframe swing high, or a successful retest may help confirm that buyers are gaining control.
The chart description indicates that price recovered toward 1.12120 after interacting with the previous-low area. This recovery supports the bullish scenario, although lower-timeframe confirmation should be evaluated directly before entering a trade.
3. Bullish Market Structure
After the liquidity sweep, the key question is whether price can establish a bullish structure. Traders may look for higher highs and higher lows, together with a sustained move above nearby resistance.
If buyers continue to defend the reclaimed previous-low area and price maintains its upward momentum, the market may attempt to reach the next significant reference level.
4. Daily Gap as a Potential Target
The chart identifies a daily gap around 1.12286. This area represents the potential upside objective illustrated by the projected price path.
Price may move toward this zone if bullish momentum continues. However, a daily gap is not guaranteed to be filled, and price may encounter resistance or reverse before reaching it.
- Liquidity reference: Previous day's low near 1.11890.
- Intermediate reference: The recovery area around 1.12120.
- Potential upside target: Daily gap near 1.12286.
5. Potential Trading Plan
- Identify the liquidity level: Mark the previous day's low near 1.11890.
- Wait for the sweep and reclaim: Observe whether price moves below the level and then returns above it.
- Seek bullish confirmation: Look for strong upward displacement or a break of lower-timeframe market structure on the 5-minute or 15-minute chart.
- Plan the entry and risk: Define a potential entry only after confirmation, with a stop-loss based on the setup's invalidation point.
- Monitor the target: Watch the daily gap near 1.12286 as a potential objective, while reassessing the setup if momentum weakens.
What Could Invalidate the Bullish Scenario?
The bullish outlook may weaken if price fails to sustain its recovery and breaks decisively below the previous day's low or the recent swing low. Such a move could indicate that sellers remain in control and that the liquidity sweep interpretation was incorrect.
Traders should avoid treating the liquidity sweep as an automatic buy signal. Price action, market structure, volatility, and the broader trend should all be considered.
Trading takeaway: Price has reacted bullishly around the previous day's low near 1.11890. If lower-timeframe bullish structure remains intact, the daily gap near 1.12286 becomes a potential upside objective. Confirmation and disciplined risk management remain essential.
Conclusion
The chart presents a potential bullish reversal scenario following a test of the previous day's low. The recovery toward 1.12120 suggests that buyers have responded to the liquidity area, while the daily gap near 1.12286 represents the next potential target.
Traders can monitor the 5-minute and 15-minute timeframes for confirmation before considering a trade. If bullish momentum weakens or price breaks back below the relevant support structure, the setup should be reassessed.
Disclaimer: This analysis is for educational and informational purposes only and does not constitute financial or investment advice. Liquidity sweeps and gap-fill scenarios are not guaranteed to produce a particular outcome. Forex trading involves substantial risk of loss. Always conduct your own research and use appropriate risk management.
```
Comments (0)
No comments yet. Be the first to comment.