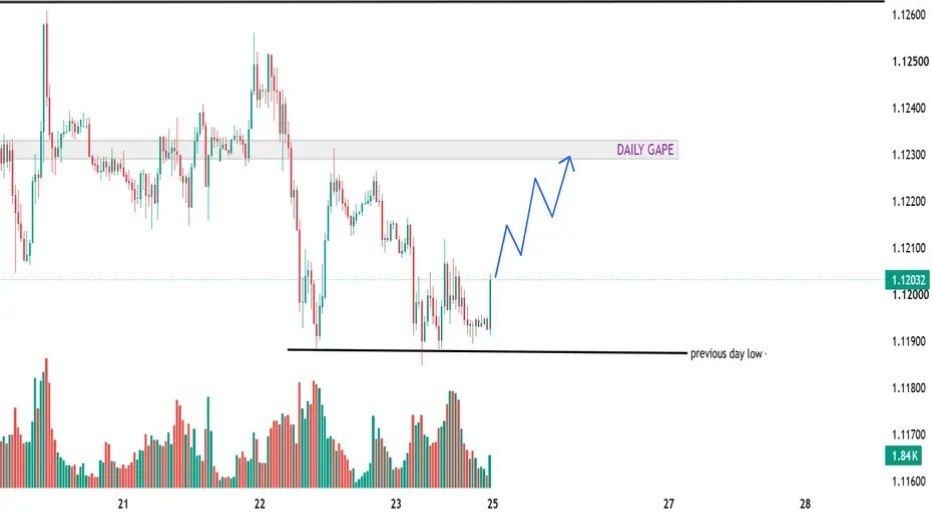
Liquidity Sweep Analysis: Bullish Reversal Toward the Daily Gap
The chart highlights a potential bullish trading setup following a liquidity sweep below the previous day's low.


The chart highlights a potential bullish trading setup following a liquidity sweep below the previous day's low.
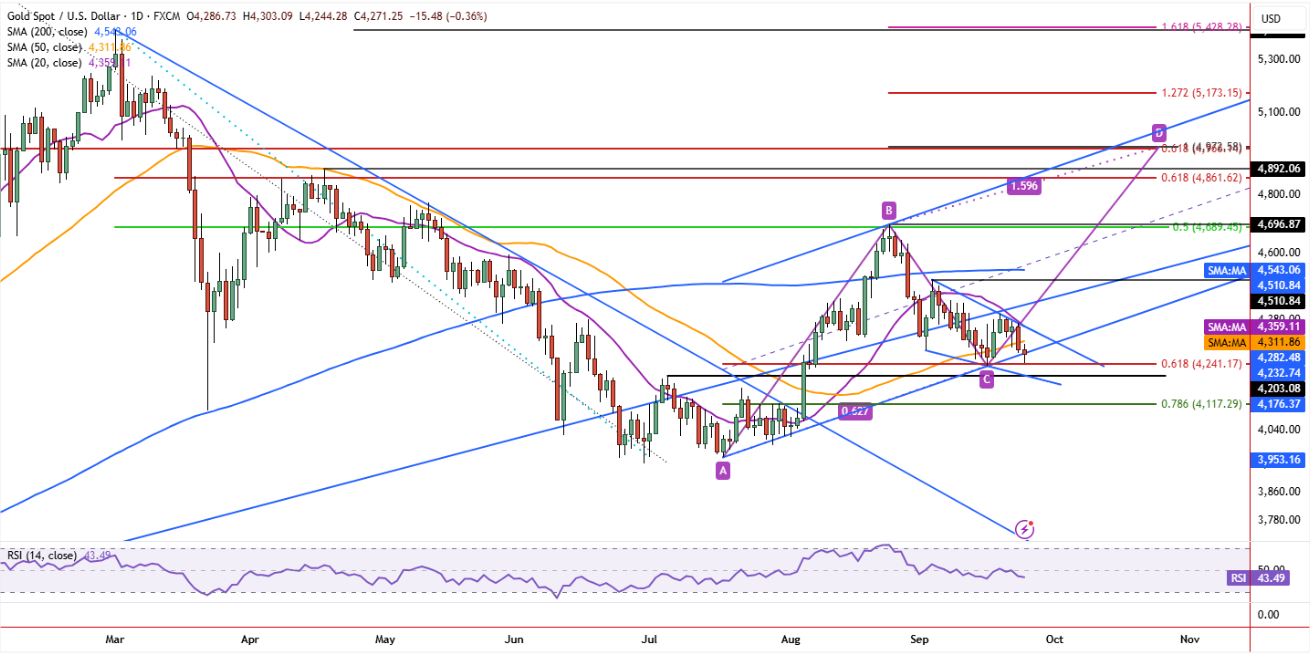
4,040–3,953: A broader support region formed around previous price action and trendline structure.
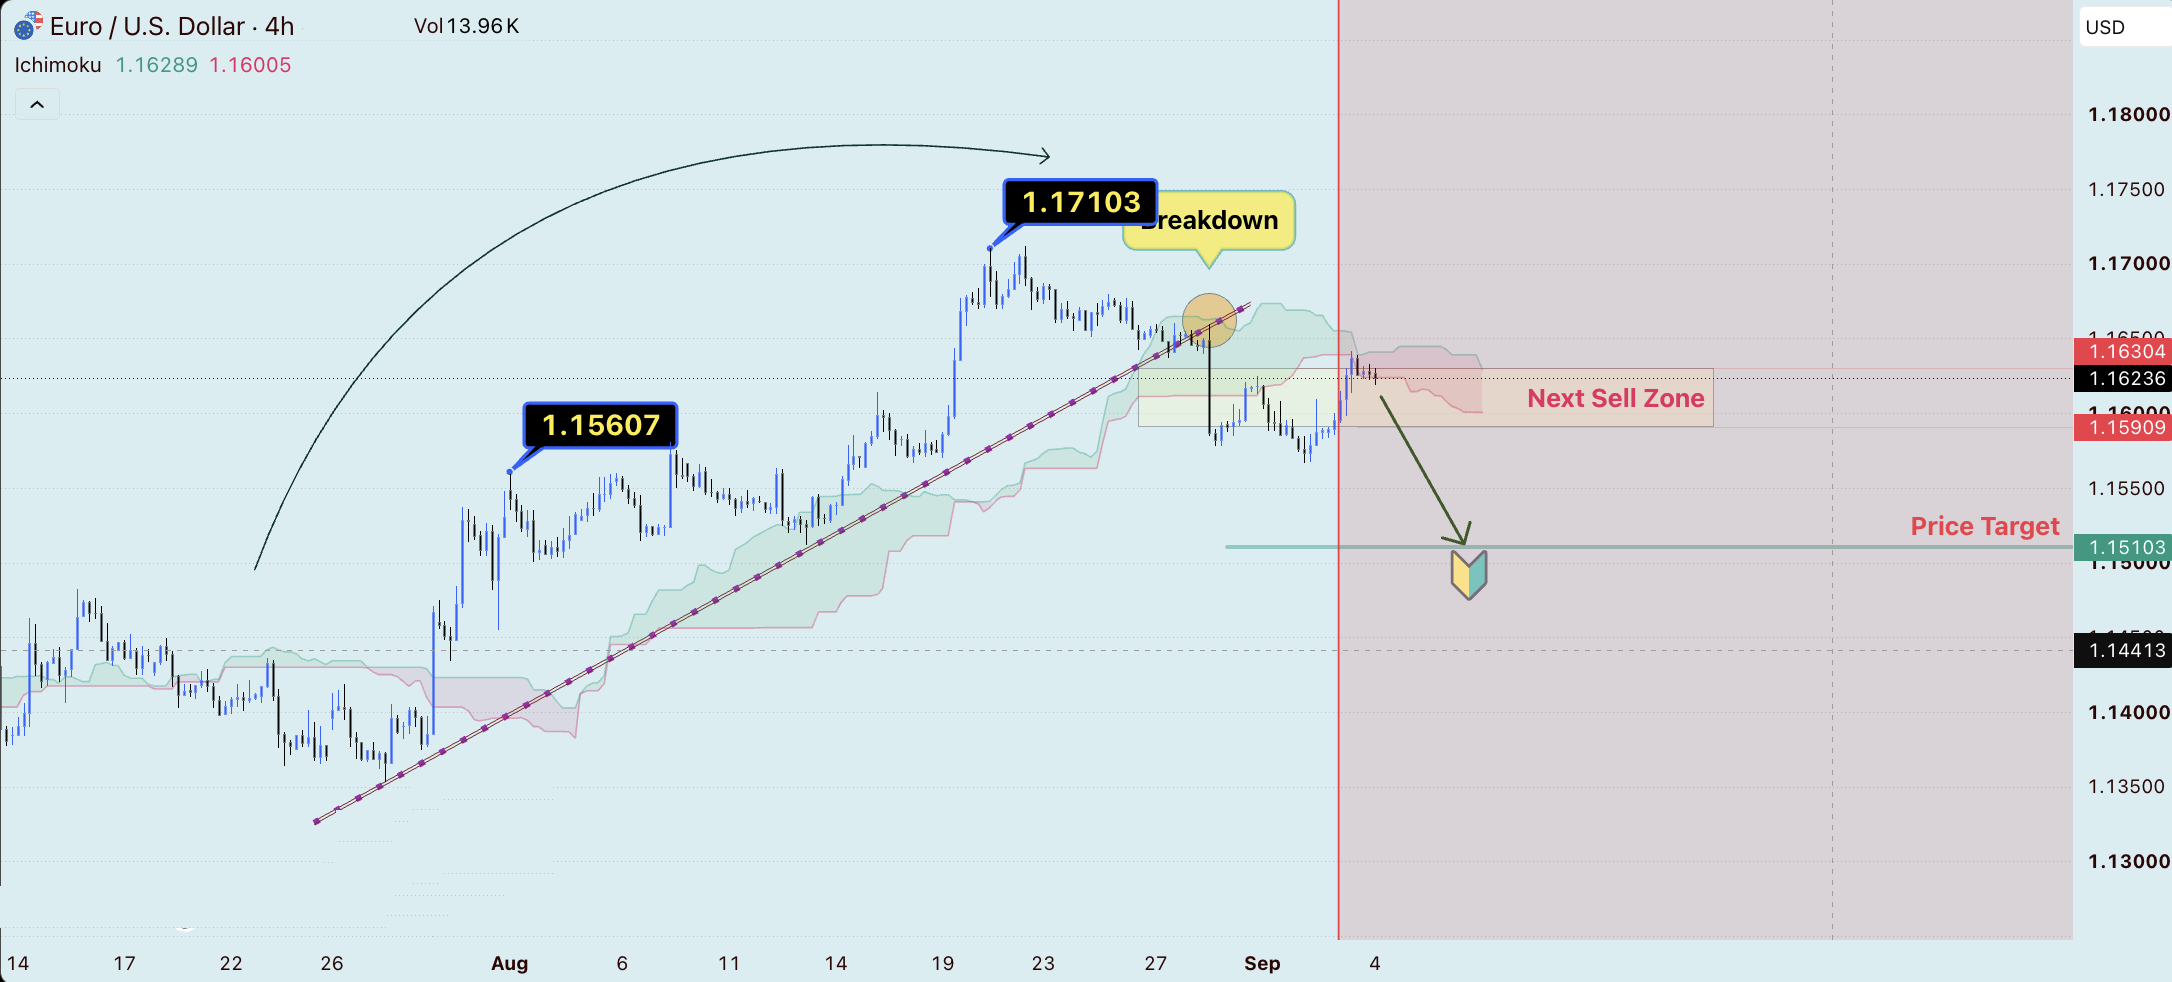
EUR/USD 4-hour chart showing bullish trendline breakdown, next sell zone and price target.
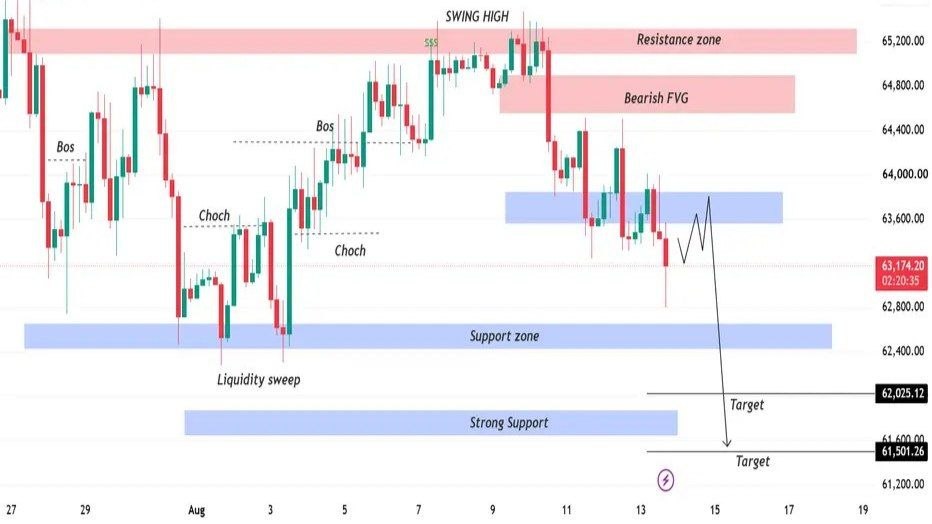
Bitcoin is currently trading around the 63,200 area and sitting at an important decision point. The chart shows a short-term bearish correction after price was rejected from the 65,200–65,300 resistance zone. Sellers have taken control in the near term, while buyers are attempting to defend the 63,500–63,800 area and prevent a deeper correction.