
Blogs

Showing 56 results in Technical Analysis Clear

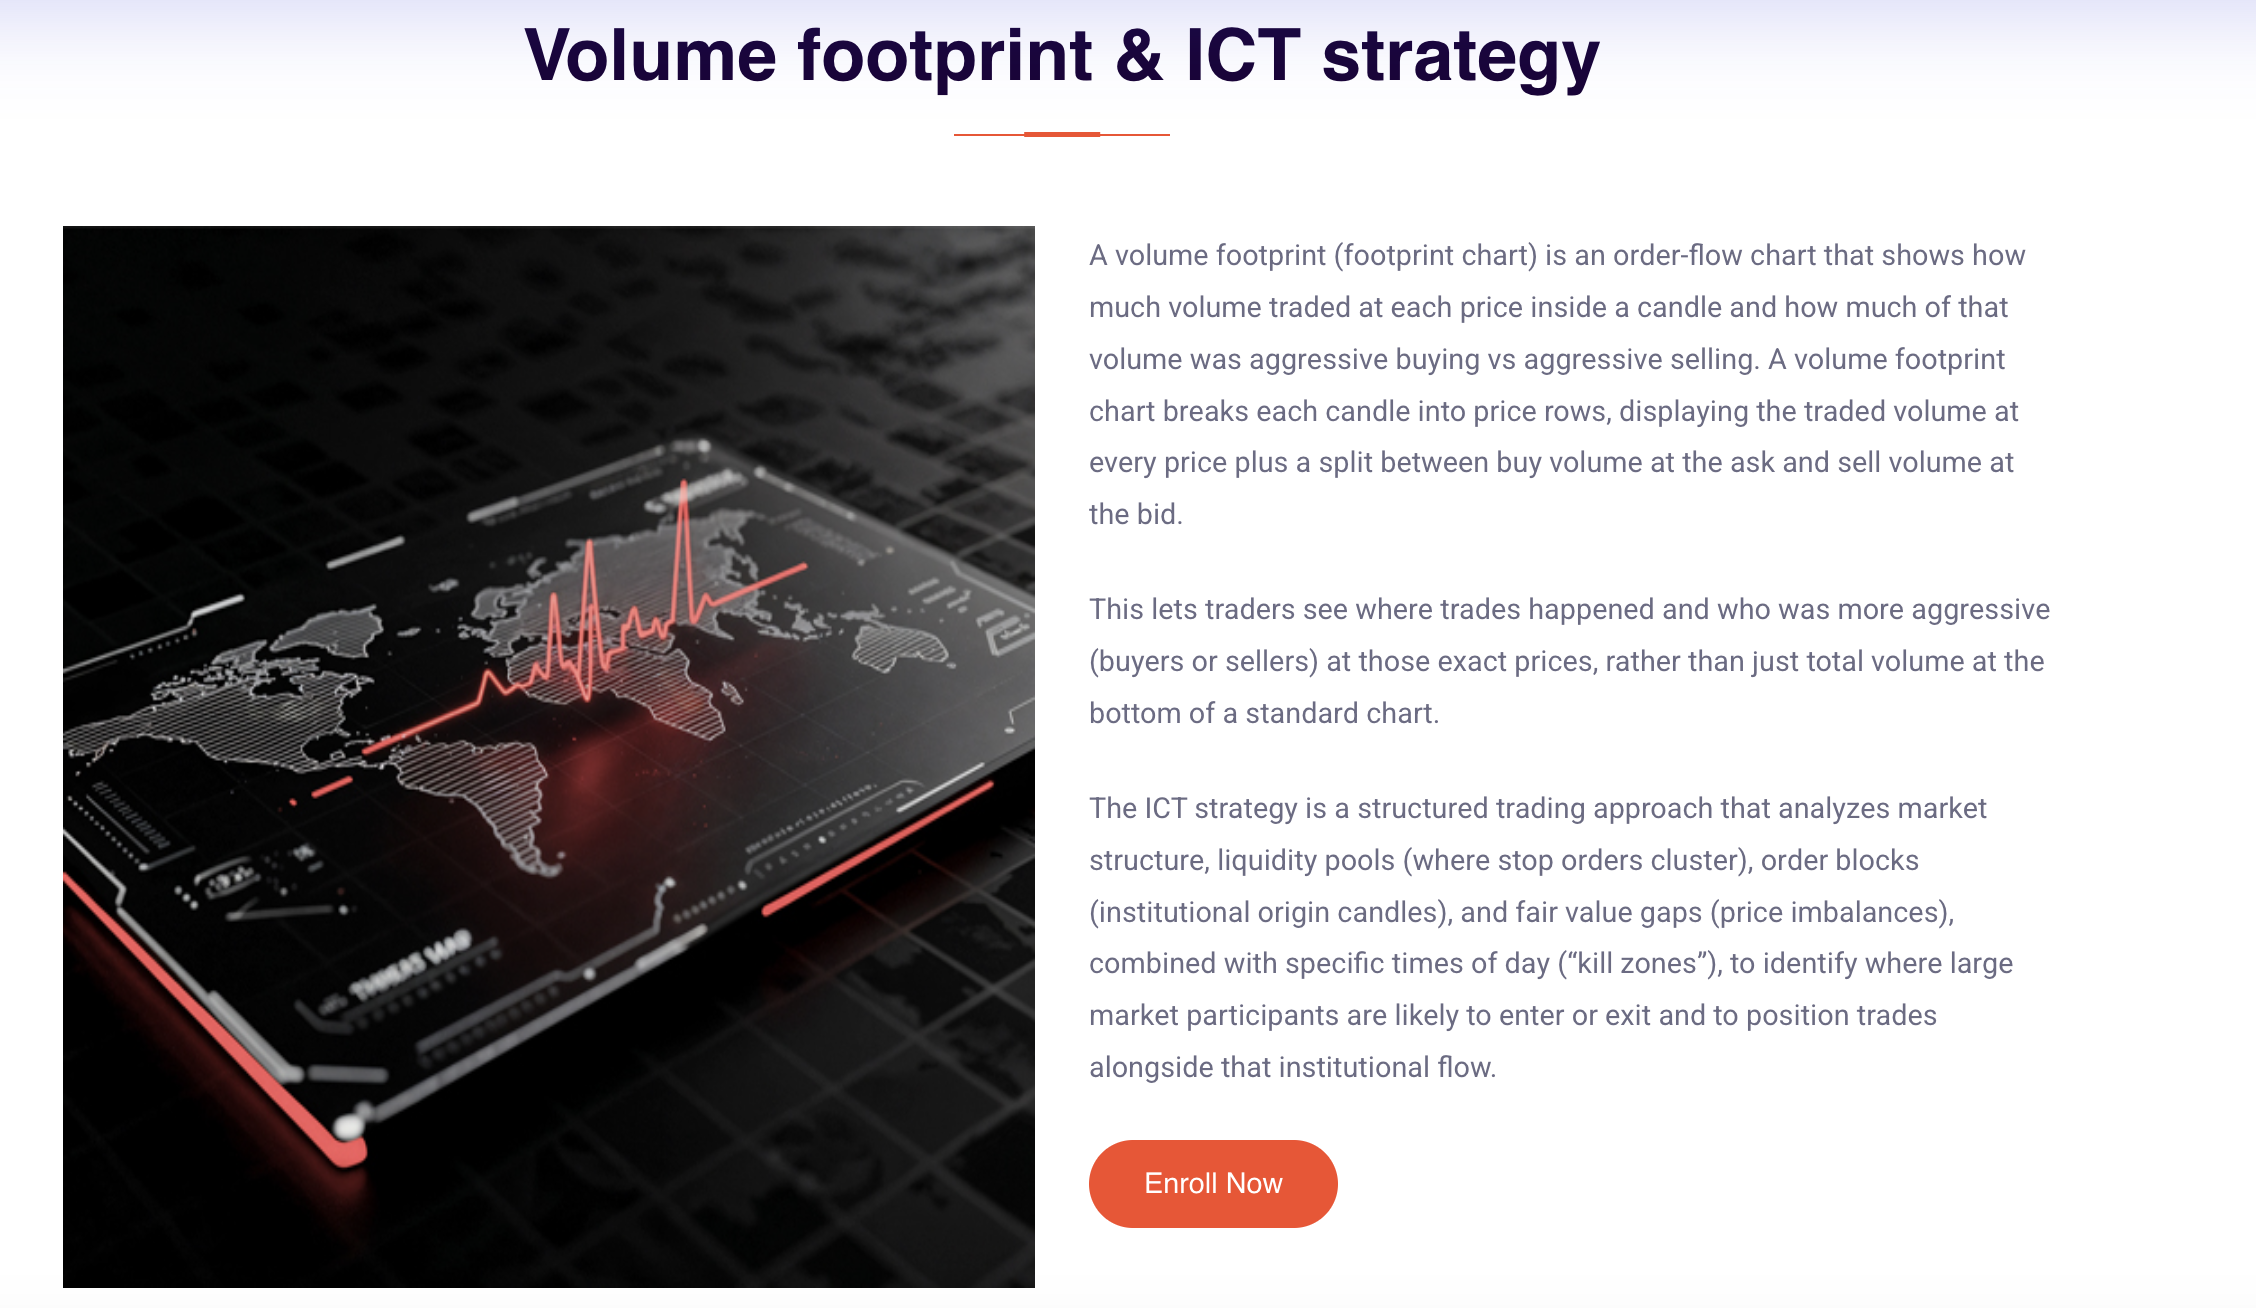
Volume footprint & ICT strategy

A volume footprint (footprint chart) is an order-flow chart that shows how much volume traded at each price inside a candle and how much of that volume was aggressive buying vs aggressive selling. A volume footprint chart breaks each candle into price rows, displaying the traded volume at every price plus a split between buy volume at the ask and sell volume at the bid.
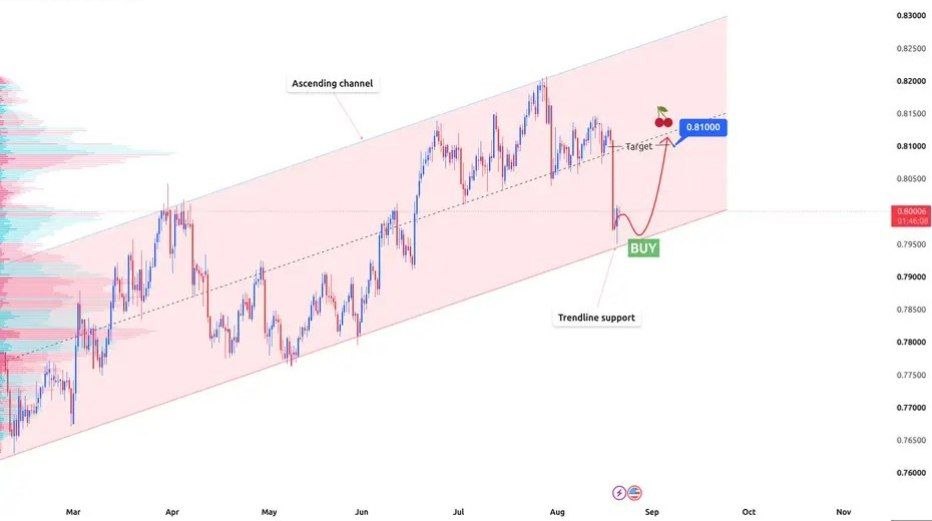
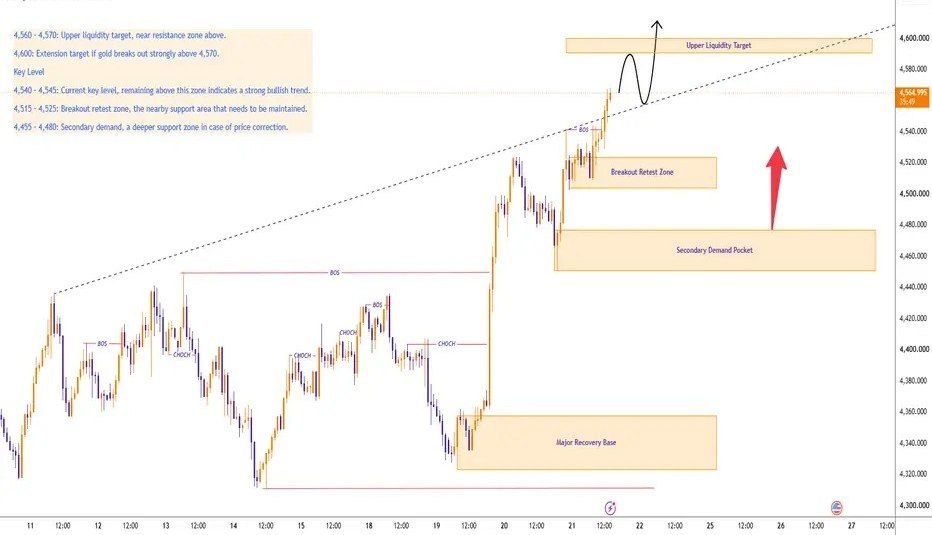
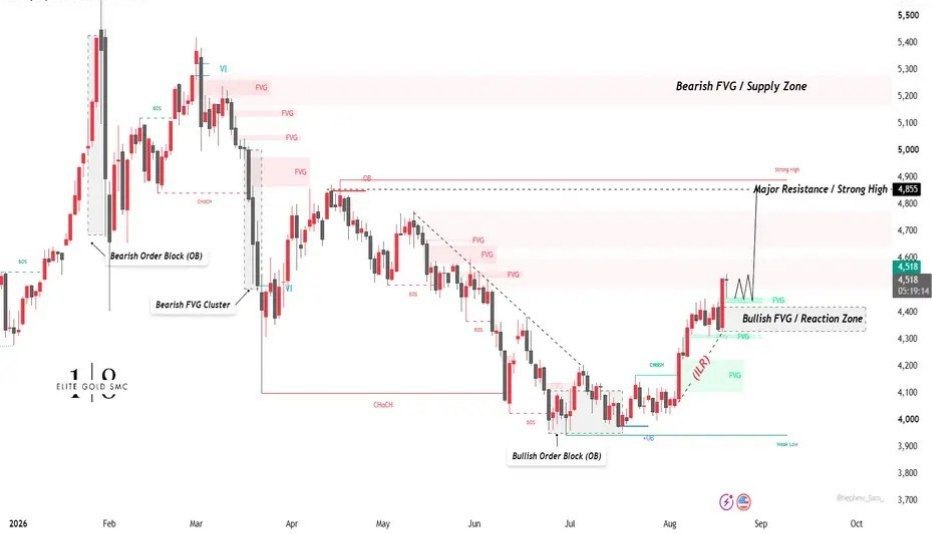
XAUUSD 4H | Market Structure, Liquidity & FVG Analysis

This XAUUSD 4H analysis focuses on market structure, liquidity, and key FVG reaction zones. The 4100–4300 area represents an important internal liquidity and reaction range, while the marked supply and demand zones highlight potential areas where price may respond. The analysis follows an SMC approach: identify liquidity, monitor structure, wait for a sweep or displacement, and seek BOS/CHoCH confirmation before considering an entry.

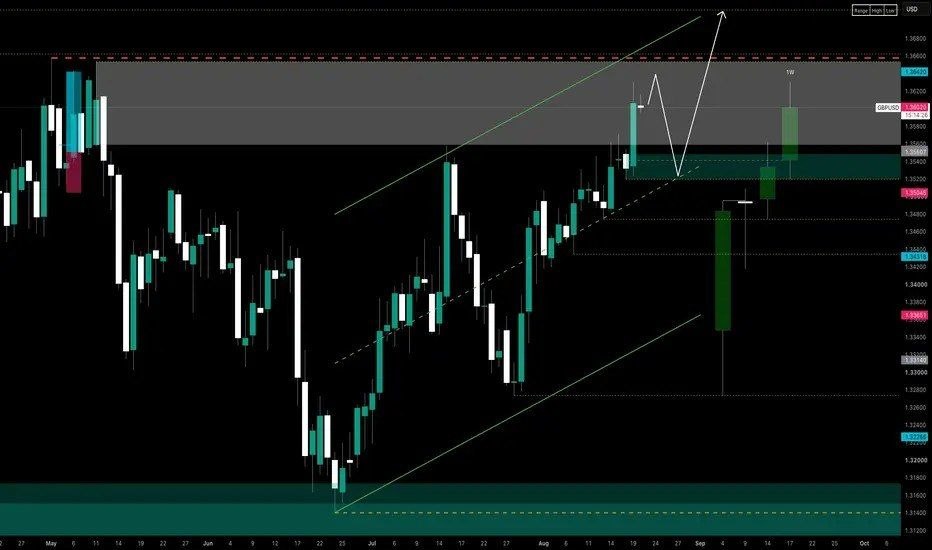
GBP/USD: 70% of Retail Traders are Short

My overall bias is still bullish, but at current prices I’m not interested in chasing the move. From a technical perspective, the structure remains constructive. Since the June lows, GBP/USD has developed a clear bullish sequence and is now trading inside the 1.3560–1.3650 resistance area. This is exactly why, despite maintaining a bullish outlook, I would rather see a pullback before looking for new long opportunities.