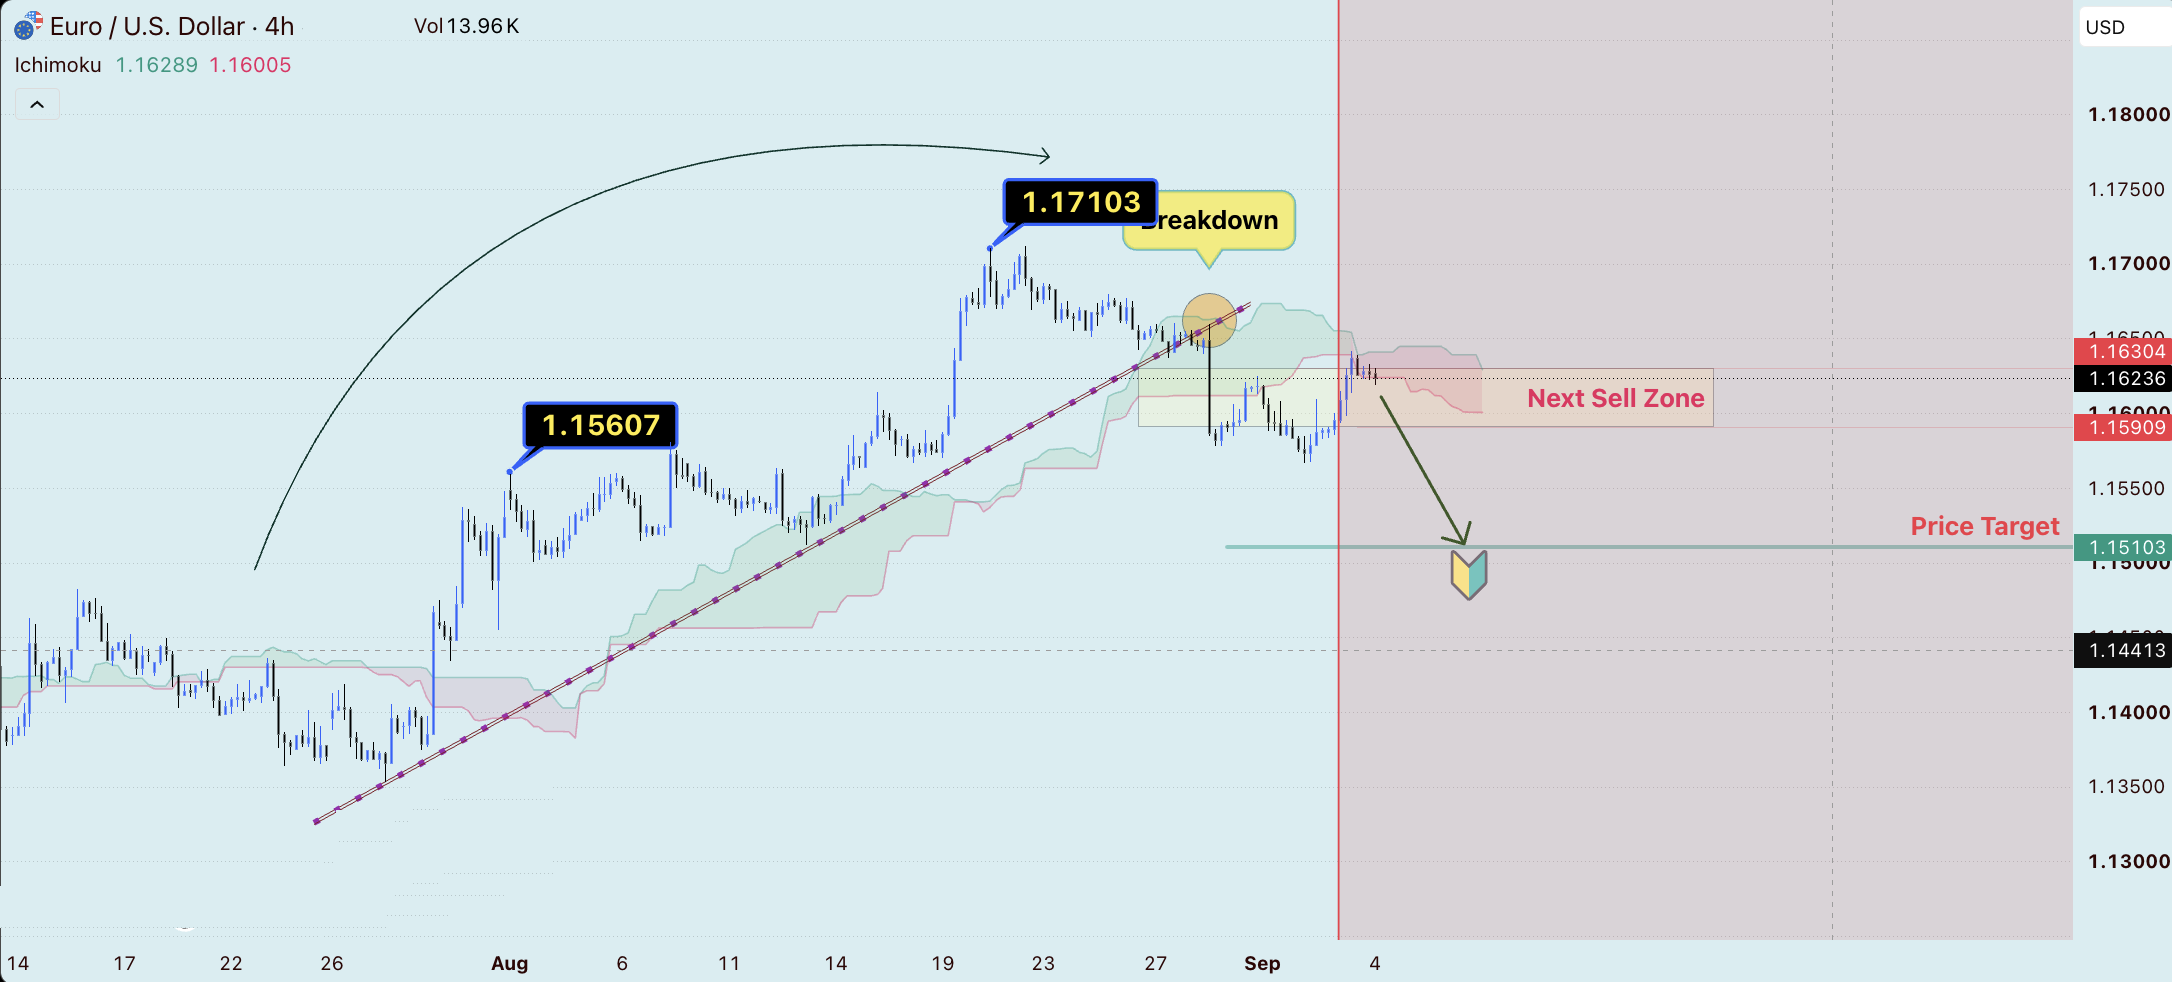
EUR/USD 4-Hour Chart Analysis: Bearish Breakdown and Next Price Target
EUR/USD 4-hour chart showing bullish trendline breakdown, next sell zone and price target.


EUR/USD 4-hour chart showing bullish trendline breakdown, next sell zone and price target.
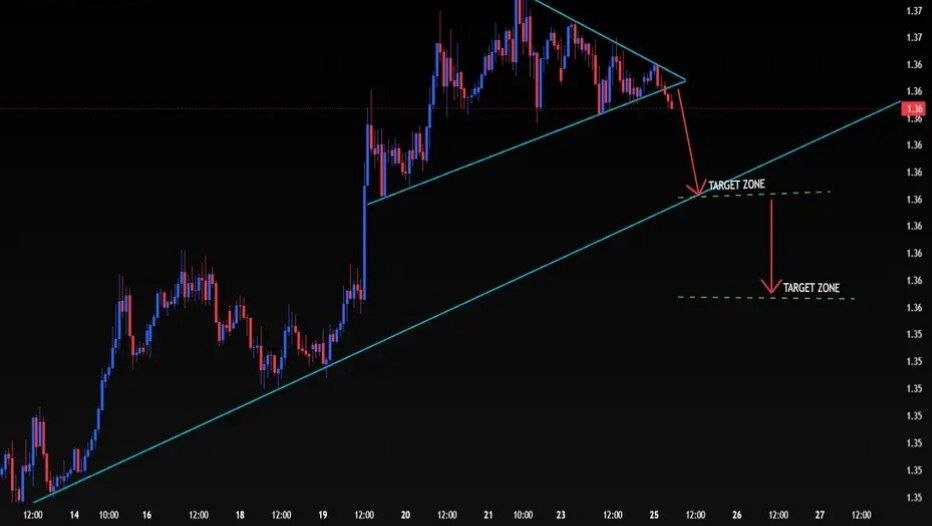
GBPUSD is consolidating inside a contracting triangle structure, with price approaching the lower trendline support. A confirmed bearish breakdown below the triangle can open the way toward the marked downside target zones. 1.3580 is the first key reaction area, while a stronger continuation could extend toward 1.3555–1.3535.
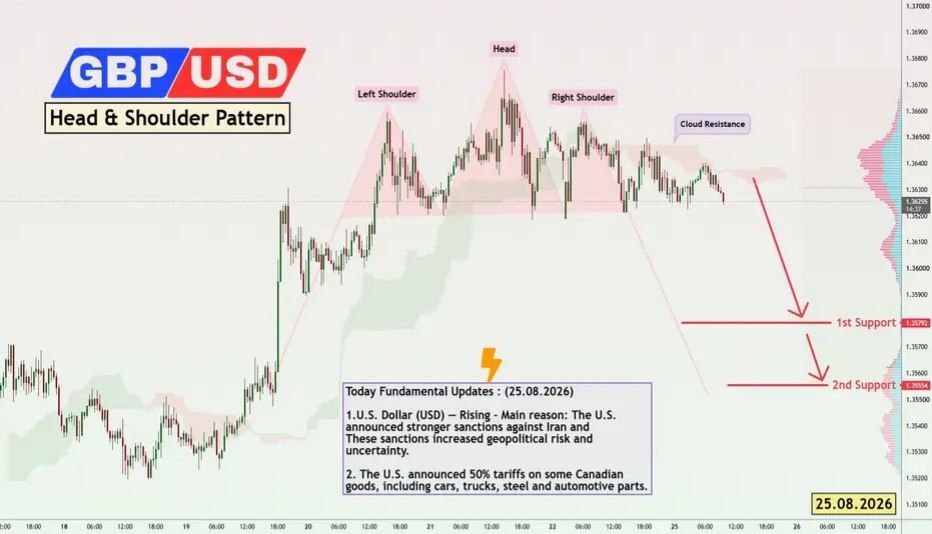
The GBP/USD pair on the m30 timeframe presents a Potential selling Opportunity due to a recent Formation of a Head and Shoulder Pattern. This suggests a shift in momentum towards the downside in the coming hours.
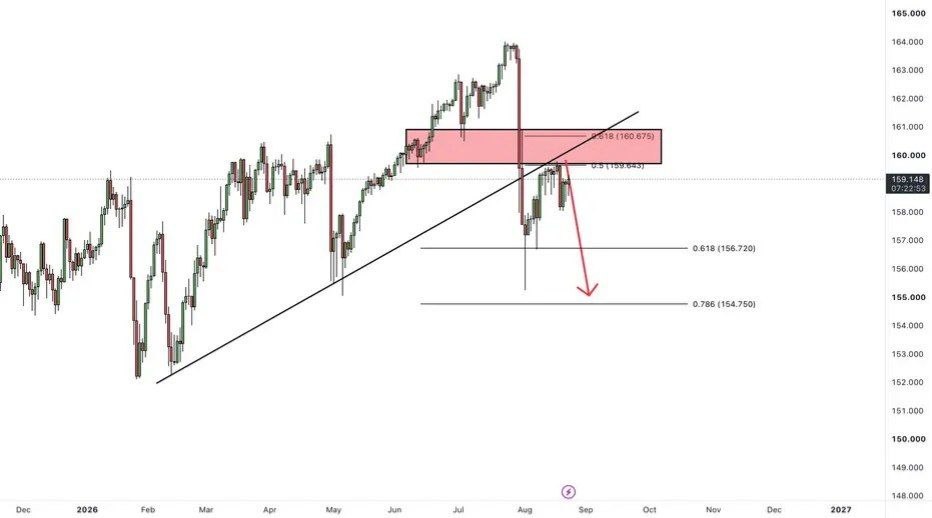
What are your thoughts on USDJPY? Following intervention by the Bank of Japan, USD/JPY experienced a sharp decline from around 164.00 to 155.00, breaking below both the ascending trendline and the key 160.00 support zone.
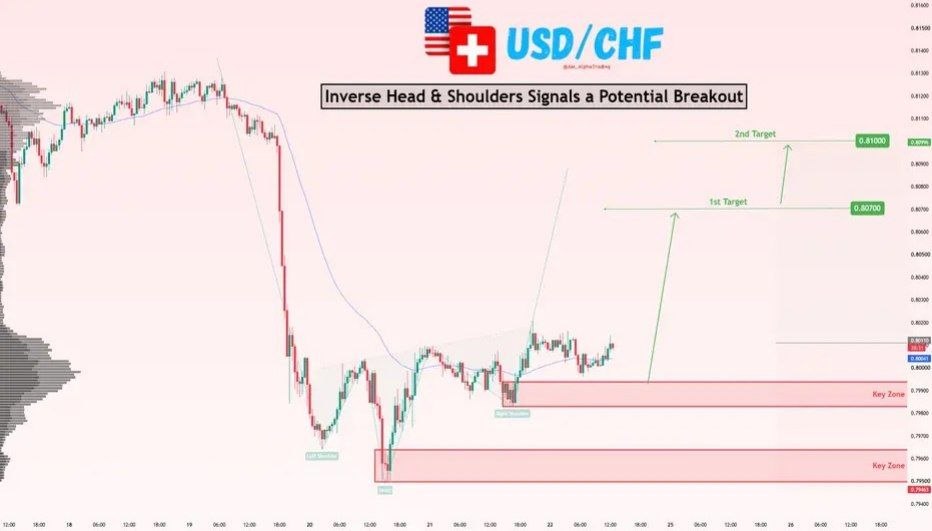
USD/CHF is showing signs of a potential bullish reversal after forming an inverse Head & Shoulders structure around the 0.7950–0.7990 demand area.
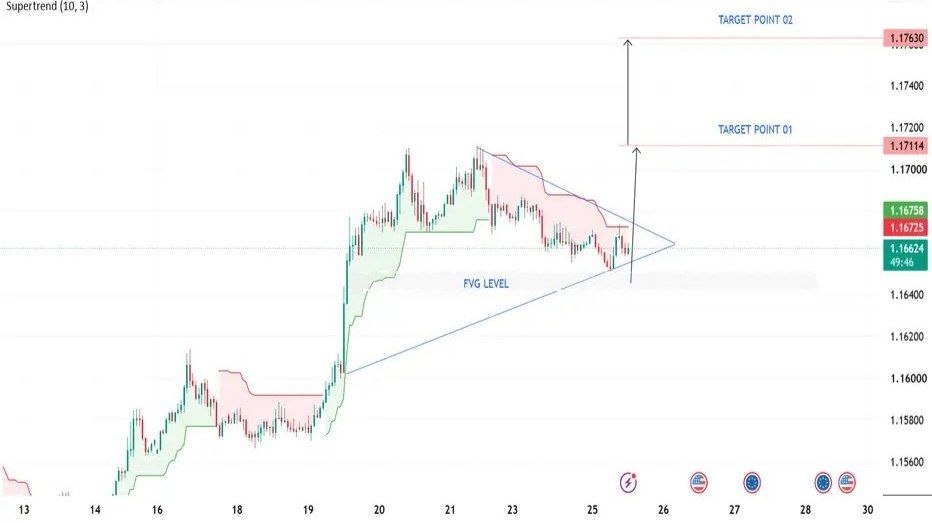
EURUSD | Bullish Trend Continuation & Breakout Potential Fundamental EURUSD remains sensitive to the relative outlook for the ECB and Federal Reserve, as well as movements in the U.S. dollar. Renewed USD weakness could support EURUSD, while stronger USD demand may pressure the pair back toward its support and FVG zones.