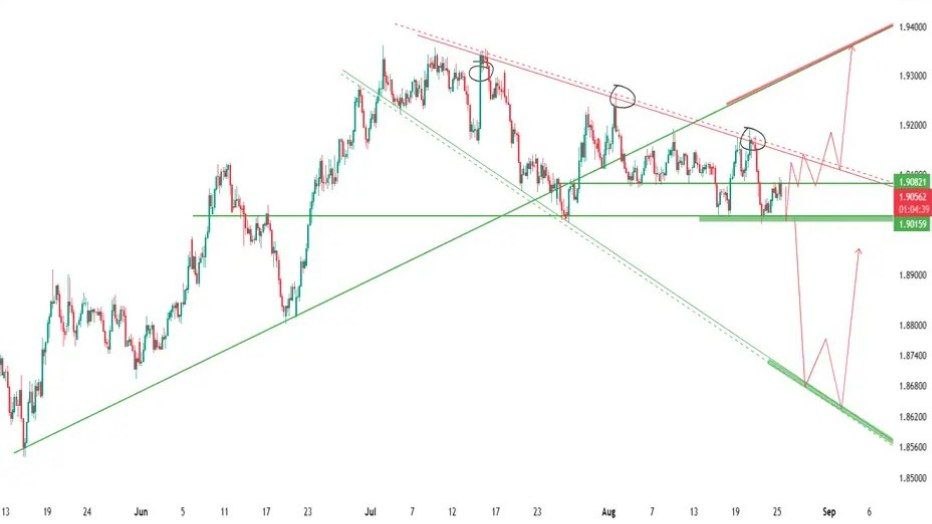
GBPAUD H4
GBPAUD 4H Chart Analysis – Shavyfxhub Strategy


GBPAUD 4H Chart Analysis – Shavyfxhub Strategy
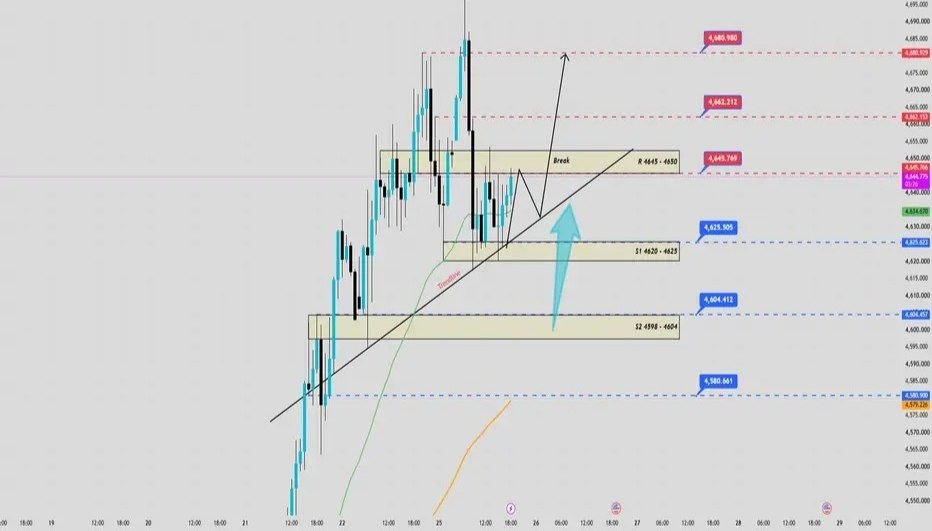
Gold continues to maintain its bullish trend as price remains above key support levels and continues to trade above the rising trendline. The EMA structure also remains bullish, with EMA34 above EMA89. Currently, price is consolidating above the S1 support zone (4620–4625).
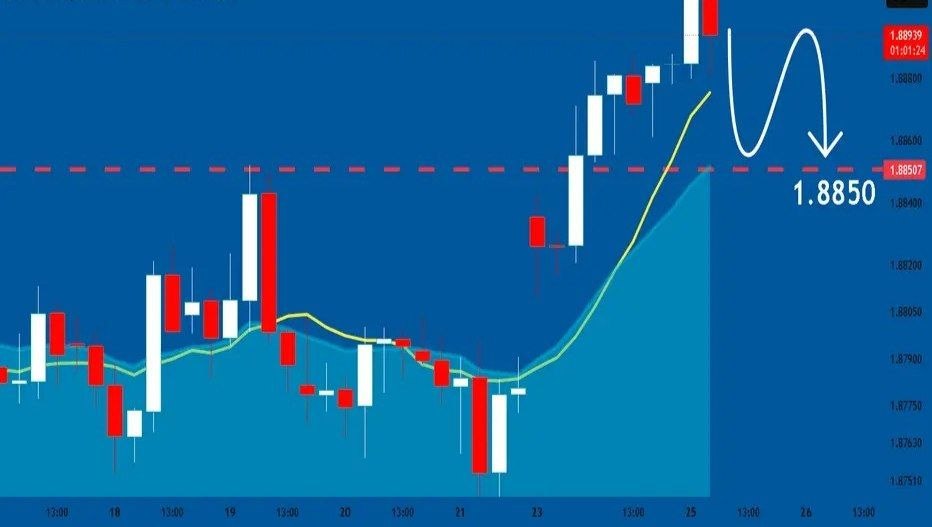
Balance of buyers and sellers on the GBPCAD pair, that is best felt when all the timeframes are analyzed properly is shifting in favor of the sellers, therefore is it only natural that we go short on the pair.

Smart Money Concept is a methodology that analyzes institutional order flow and liquidity manipulation using tools like order blocks, liquidity grabs, fair value gaps, and market-structure shifts to align trades with “smart money” rather than retail flows.
A volume footprint (footprint chart) is an order-flow chart that shows how much volume traded at each price inside a candle and how much of that volume was aggressive buying vs aggressive selling. A volume footprint chart breaks each candle into price rows, displaying the traded volume at every price plus a split between buy volume at the ask and sell volume at the bid.
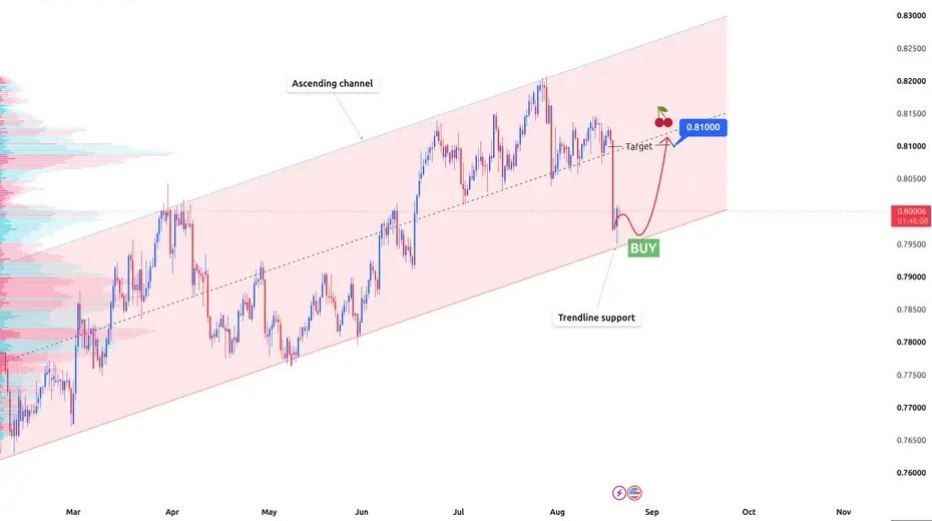
USDCHF is correcting after being rejected near the upper edge of the rising channel. The decline has brought price back to the lower trendline, which has supported the trend several times before.