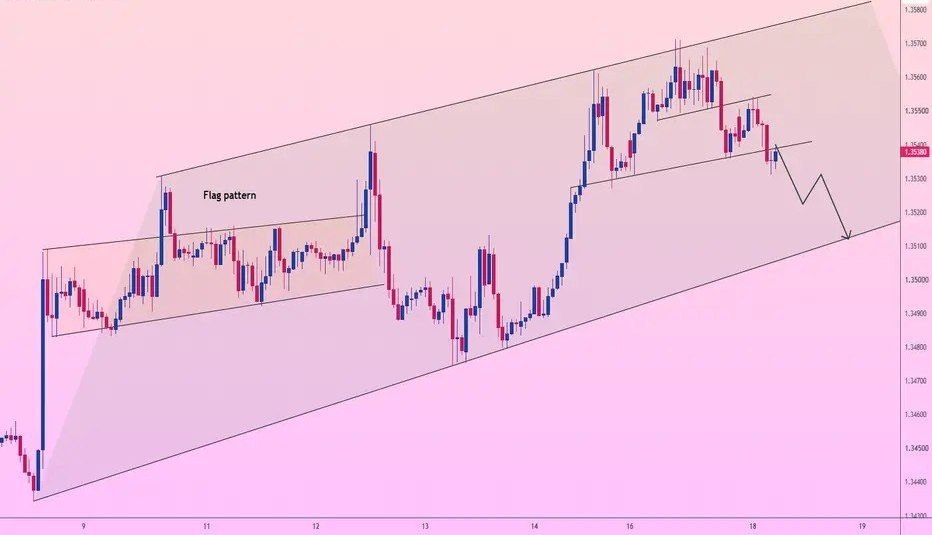
GBP/USD: THE 1.35100 FLAG BREAKDOWN FLUSH!
Testing lower flag support near 1.35375! Are you panic-buying this minor pause, or positioning for the multi-wave drop to the 1.35100 channel floor? 🤔


Testing lower flag support near 1.35375! Are you panic-buying this minor pause, or positioning for the multi-wave drop to the 1.35100 channel floor? 🤔
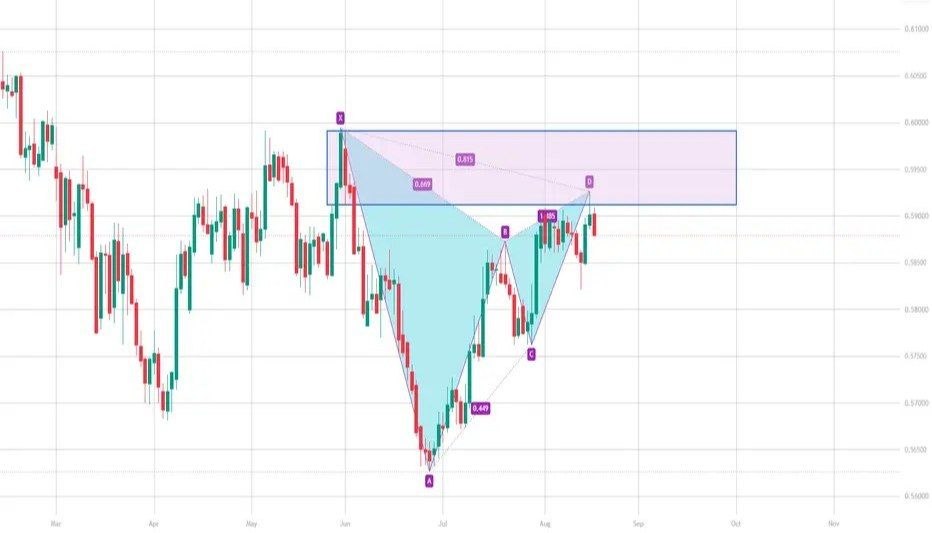
On the daily chart, NZDUSD encountered resistance and fell back after testing the previous supply zone, forming a bearish Gartley pattern in the short term. Currently, the 0.5890-0.5900 area is worth watching; short positions can be considered if a rebound encounters resistance, with a downside target around 0.5800.
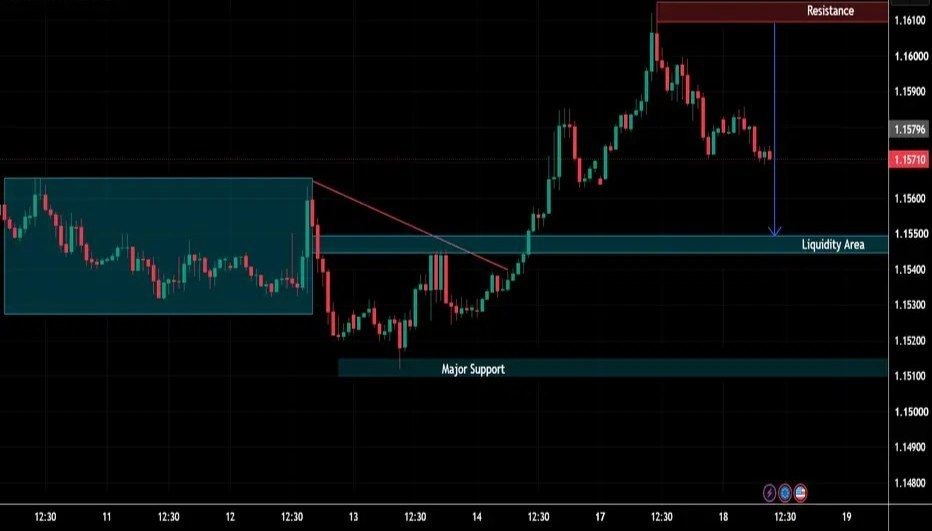
EUR/USD is showing a strong bullish recovery after bouncing from the major support zone around 1.1510–1.1520. Price broke above the 1.1540–1.1550 liquidity area and moved toward the 1.1600–1.1610 resistance zone.
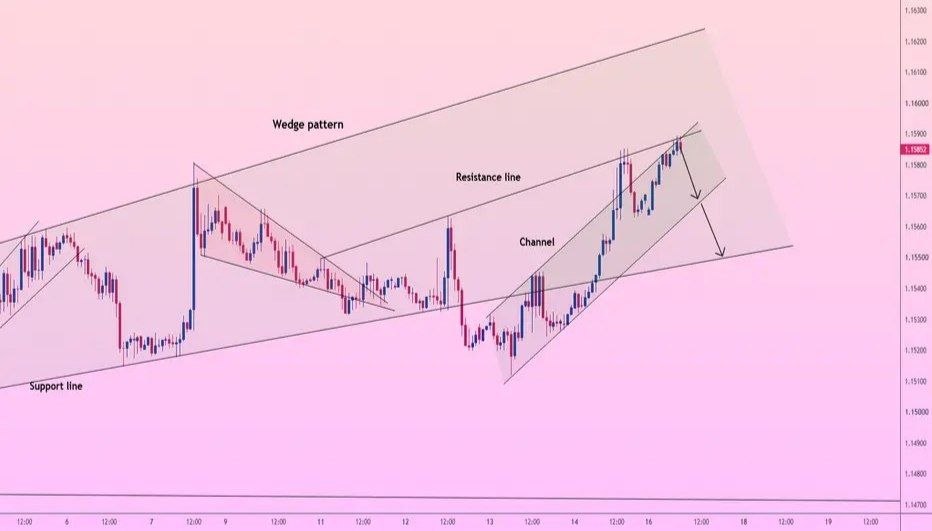
Testing upper channel resistance at 1.15852! Are you blindly buying into this top channel boundary, or positioning for the multi-wave breakdown flush to macro support? 🤔
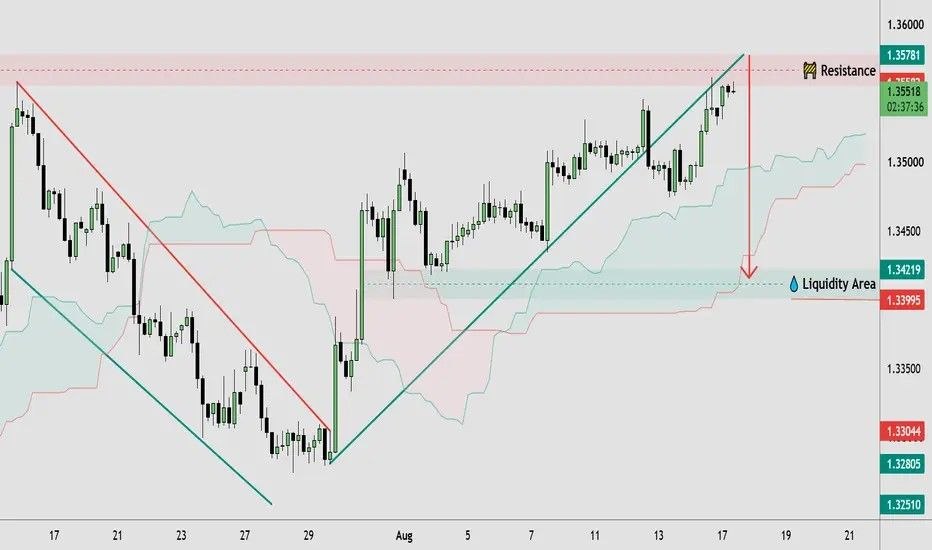
GBPUSD is showing a clear recovery structure, with price forming higher highs and higher lows while respecting the rising trendline. The current move is approaching a marked resistance zone around 1.3570–1.3580, where price appears to be facing potential selling pressure.
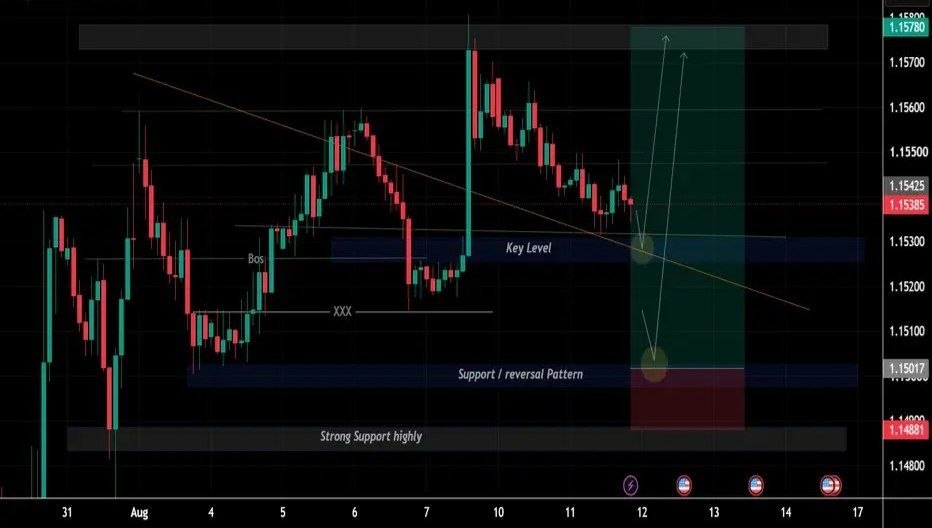
EUR/USD is currently trading under short-term bearish pressure, but price is approaching a major key support zone around 1.1528–1.1532, where buyers could step back into the market.