

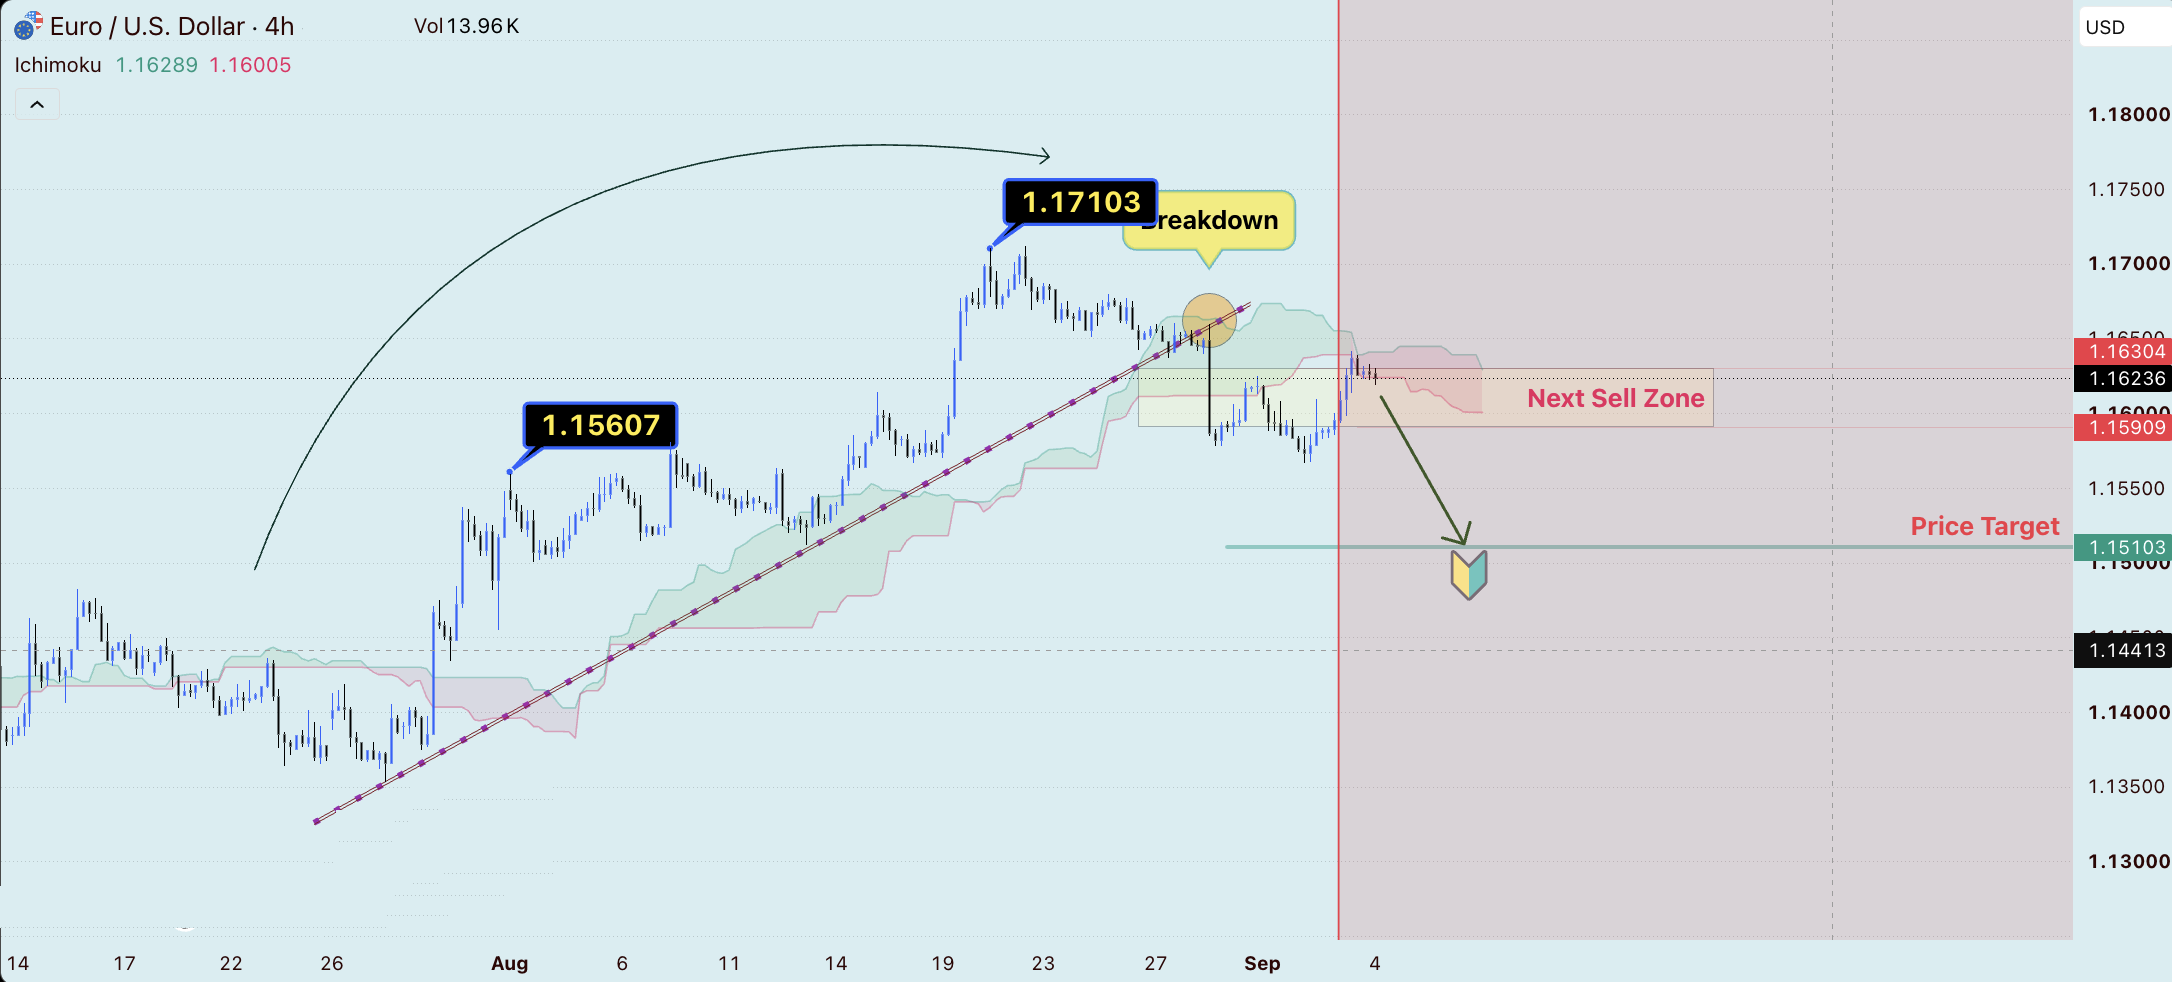
The EUR/USD 4-hour chart shows a potential shift from the previous bullish trend toward a more bearish structure. Price had been moving higher along a clearly defined ascending trendline before encountering resistance near the 1.17103 area.
Key Technical Levels
- 1.17103: Major recent swing high and resistance area.
- 1.16304: Important upper reference level and potential resistance.
- 1.16236: Current price area shown on the chart.
- 1.15909: Lower boundary of the highlighted sell-zone region.
- 1.15103: Projected downside price target.
- 1.15607: Previous swing-high reference visible on the chart.
Trendline Breakdown
EUR/USD previously respected an ascending trendline, indicating consistent buying pressure. However, the chart shows price breaking below this trend structure around the end of August. This breakdown is an important technical signal because it suggests that the previous bullish momentum may be weakening.
Following the breakdown, price moved lower and subsequently attempted to recover. The chart indicates that the recovery is approaching the marked “Next Sell Zone”, making this area important for traders watching for a bearish continuation setup.
Next Sell Zone
The highlighted area around 1.15909–1.16304 is identified on the chart as the next potential selling zone. If price moves into this region and encounters selling pressure, traders may look for confirmation of another downward move.
Key idea: The bearish scenario becomes more attractive if EUR/USD fails to reclaim the broken trend structure and sellers regain control around the highlighted resistance/sell zone.
Potential Price Target
The chart projects a downside move toward approximately 1.15103. This level represents the marked Price Target and could become relevant if the bearish structure remains intact.
Possible Bearish Scenario
- EUR/USD rallies toward the highlighted 1.15909–1.16304 area.
- Price encounters resistance and selling pressure.
- The pair fails to reclaim the broken ascending trendline.
- Bearish momentum resumes below the recent support structure.
- The downside move could then extend toward the projected 1.15103 target.
What Would Invalidate the Bearish View?
A sustained move back above the highlighted resistance area, followed by a successful reclaim of the broken trendline, could weaken the bearish setup. Traders should therefore wait for price-action confirmation rather than entering a position solely because of the projected target.
Ichimoku Perspective
The chart also includes the Ichimoku Cloud. The interaction between price and the cloud can provide additional information about trend direction, support, and resistance. A continued rejection around the cloud and the former trendline would support the bearish interpretation, while a strong move back above the cloud could indicate improving bullish momentum.
Trading Disclaimer
Disclaimer: This analysis is for educational and informational purposes only and should not be considered financial or investment advice. Forex trading involves substantial risk, and losses can exceed expectations. The levels shown are technical reference points based on the attached chart and may change as market conditions develop. Always conduct your own analysis, use appropriate risk management, and never trade with money you cannot afford to lose.
Technical levels should be treated as areas of interest rather than guaranteed entry or exit points. Confirmation from price action, market structure, and risk management is essential before making any trading decision.
Comments (0)
No comments yet. Be the first to comment.