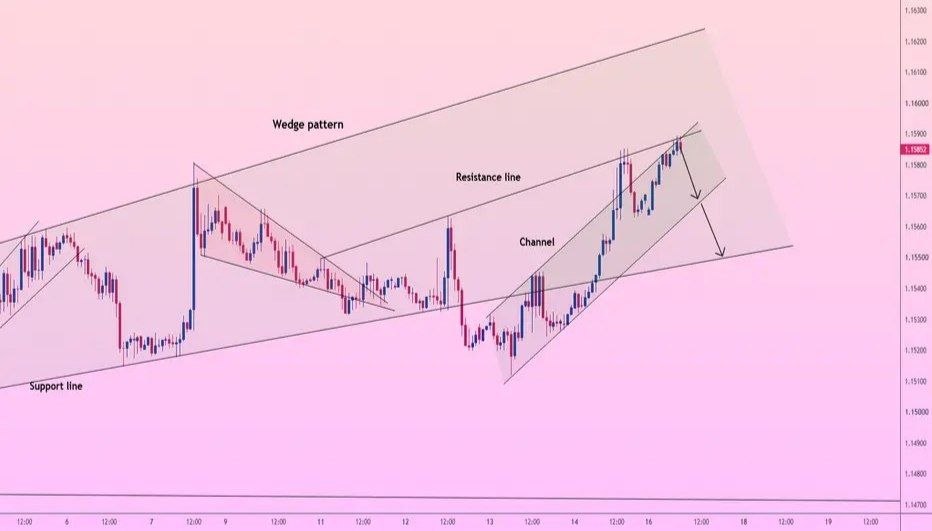
EUR/USD: THE 1.15500 CHANNEL BREAKDOWN FLUSH!
Testing upper channel resistance at 1.15852! Are you blindly buying into this top channel boundary, or positioning for the multi-wave breakdown flush to macro support? 🤔


Testing upper channel resistance at 1.15852! Are you blindly buying into this top channel boundary, or positioning for the multi-wave breakdown flush to macro support? 🤔
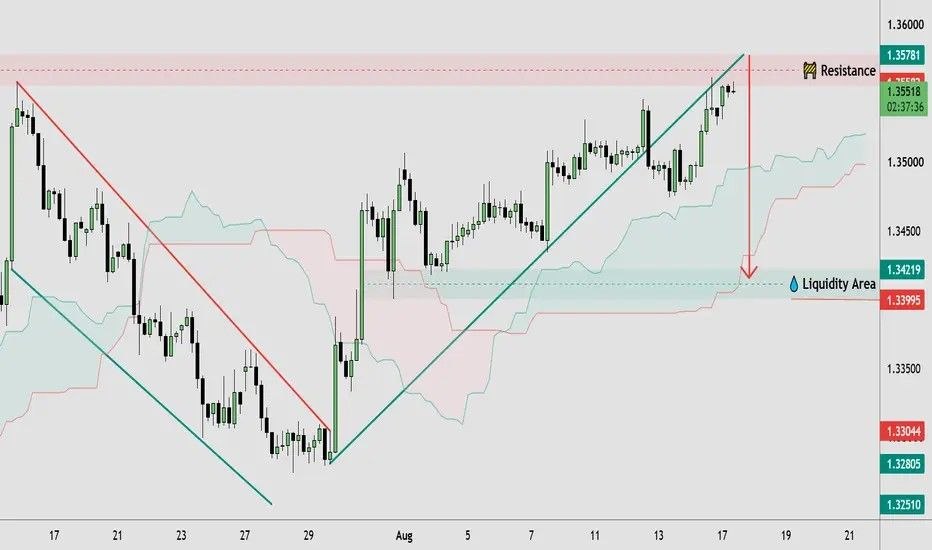
GBPUSD is showing a clear recovery structure, with price forming higher highs and higher lows while respecting the rising trendline. The current move is approaching a marked resistance zone around 1.3570–1.3580, where price appears to be facing potential selling pressure.
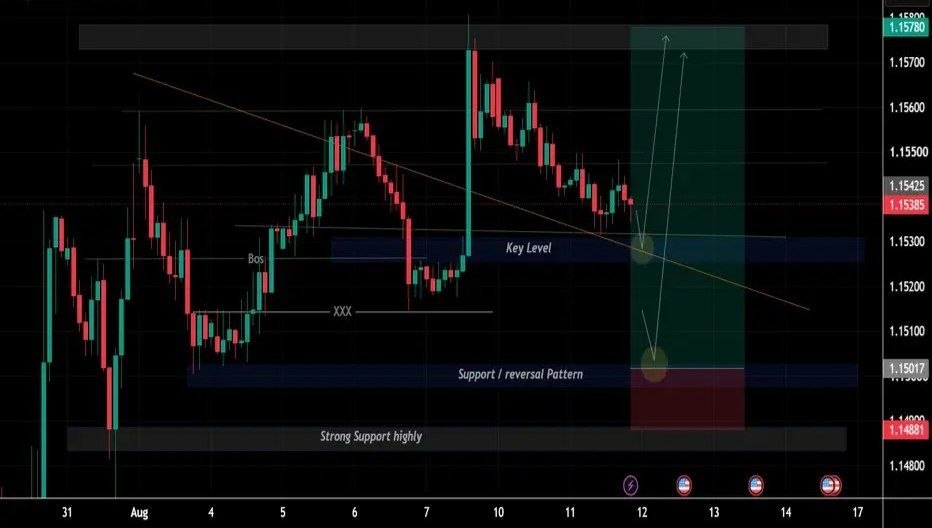
EUR/USD is currently trading under short-term bearish pressure, but price is approaching a major key support zone around 1.1528–1.1532, where buyers could step back into the market.
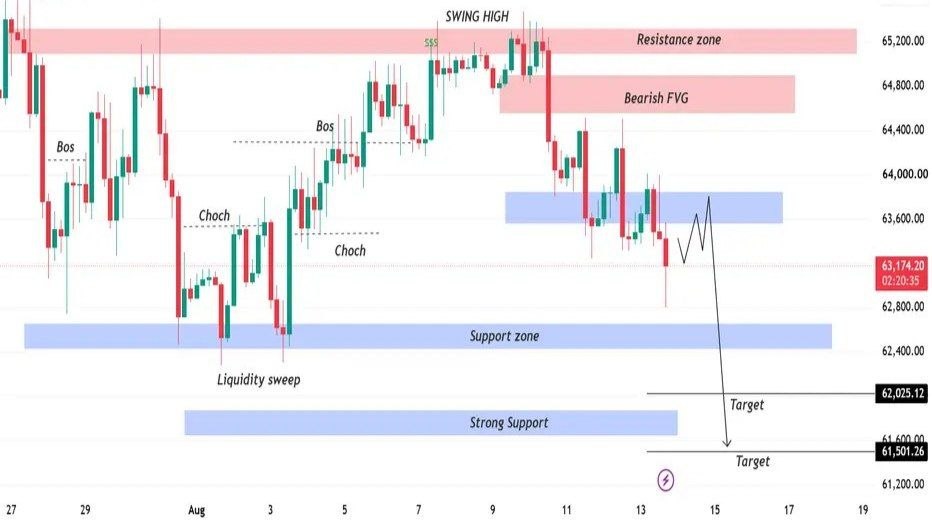
Bitcoin is currently trading around the 63,200 area and sitting at an important decision point. The chart shows a short-term bearish correction after price was rejected from the 65,200–65,300 resistance zone. Sellers have taken control in the near term, while buyers are attempting to defend the 63,500–63,800 area and prevent a deeper correction.
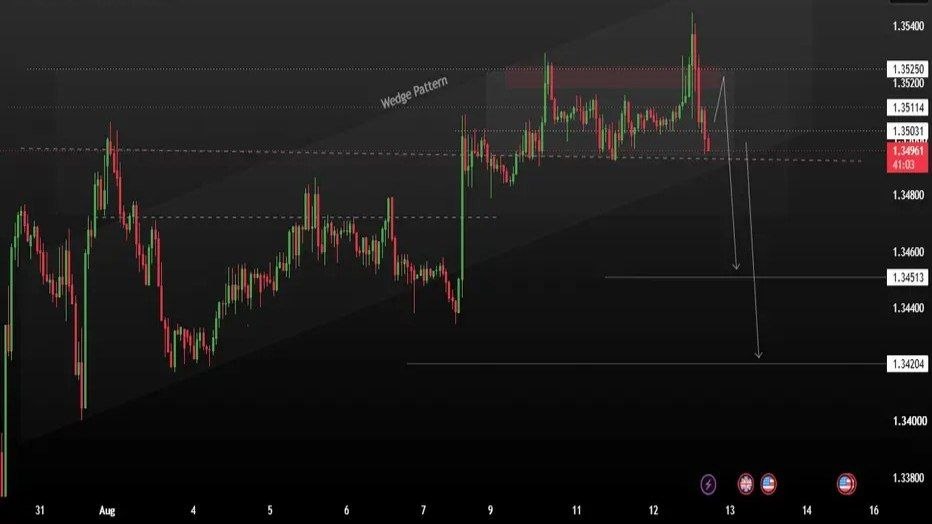
GBP/USD is showing increasing short-term selling pressure after repeatedly failing to sustain a move above the 1.3520–1.3525 resistance zone. Price pushed higher into this supply area but faced strong rejection, leaving a clear sign that sellers are still defending the upper levels.
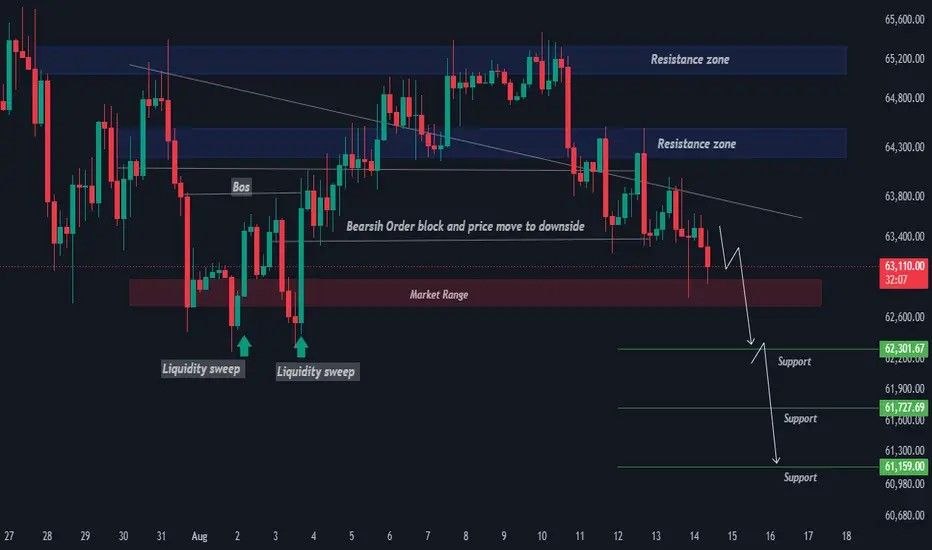
BTCUSD – H4 has rejected the major resistance zone and is showing clear signs of weakening bullish momentum. Price is currently trading around 63,088, below the nearby resistance area, while the bearish order block and descending structure suggest sellers are gaining control.