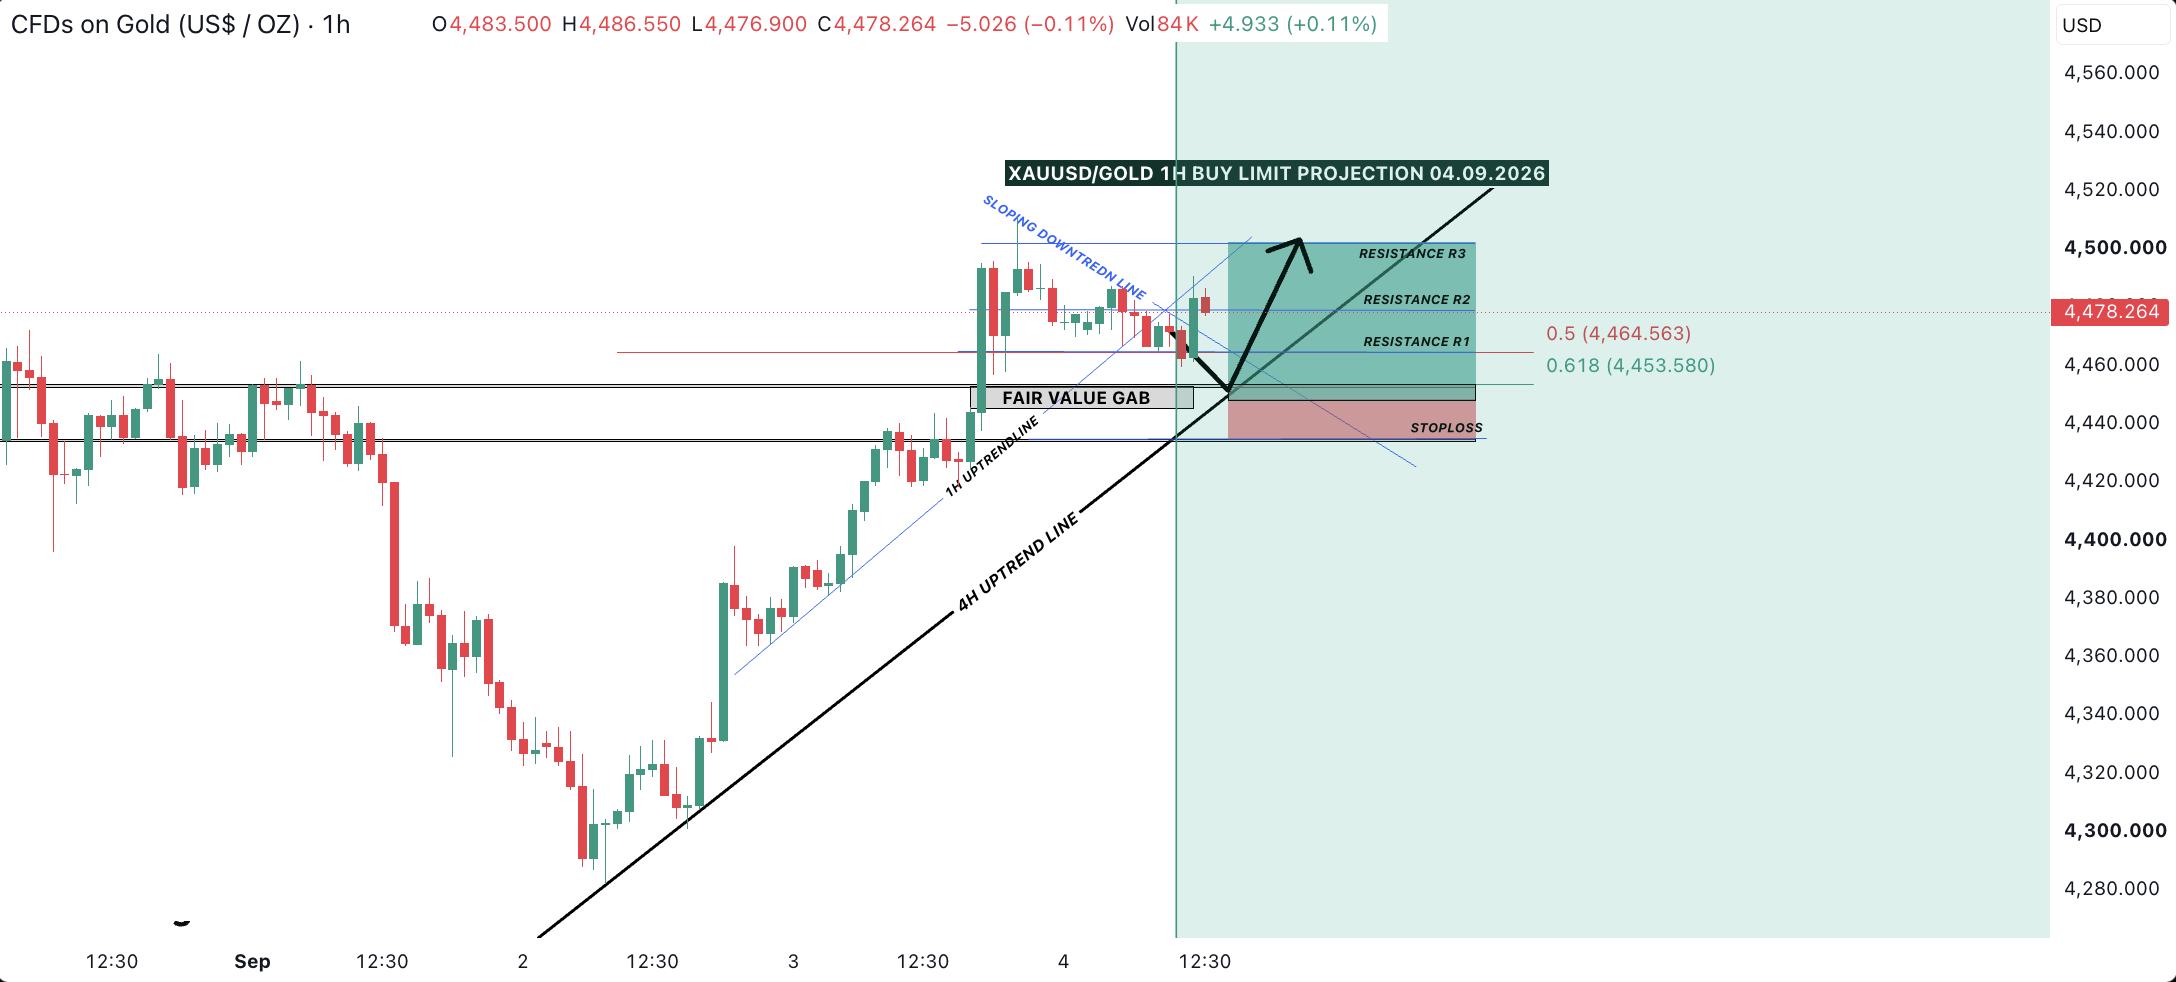
Gold XAU/USD 1-hour chart showing buy limit projection!
Gold XAU/USD 1-hour chart showing buy limit projection, fair value gap, Fibonacci levels and resistance zones.

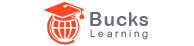
Gold XAU/USD 1-hour chart showing buy limit projection, fair value gap, Fibonacci levels and resistance zones.
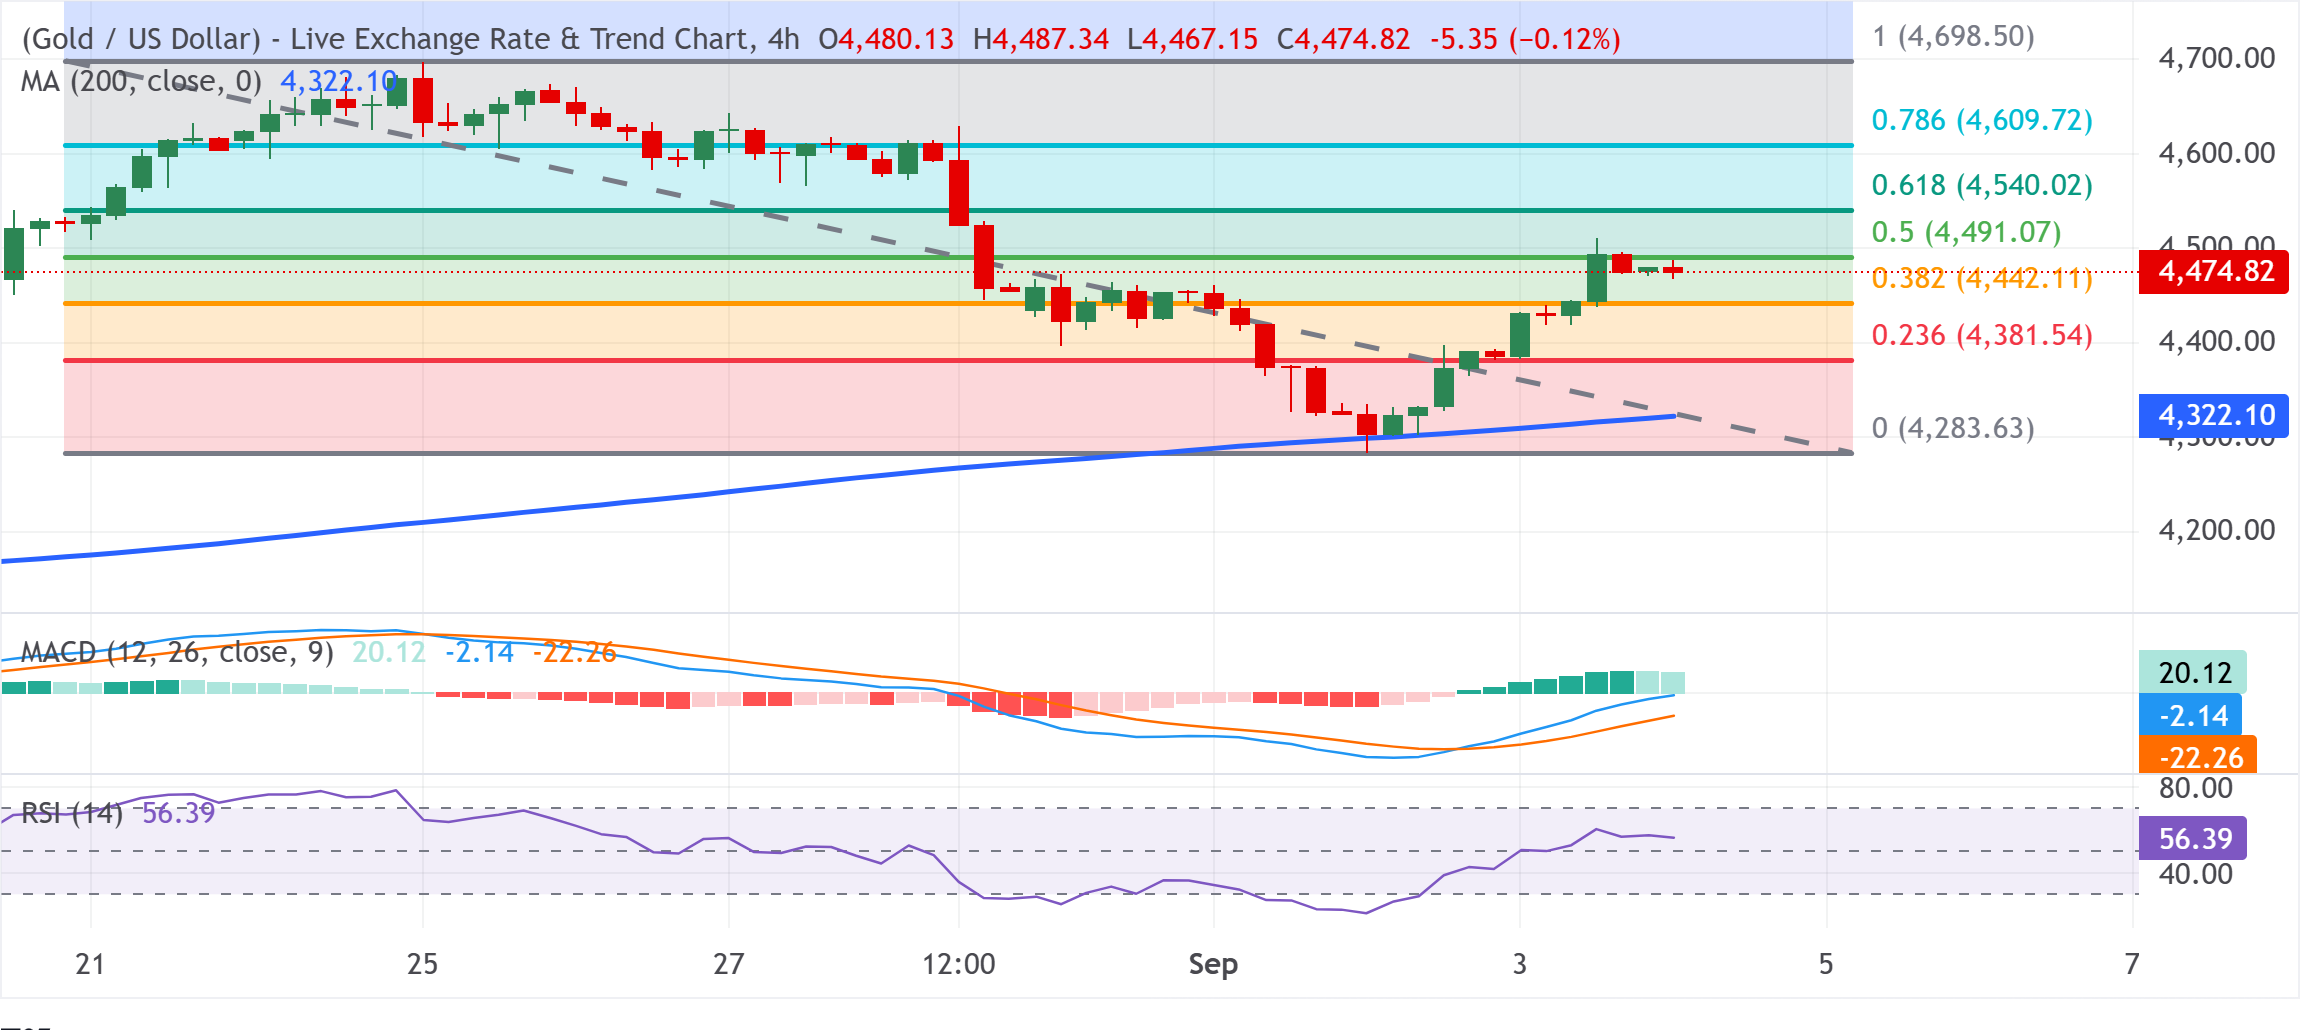
Gold (XAU/USD) trades as a currency pair against the US Dollar and is widely regarded as a safe-haven asset, tending to rise during market volatility, economic uncertainty, and periods of currency devaluation. As a yield-less asset, it's sensitive to interest rates and the strength of the US Dollar, with central banks.
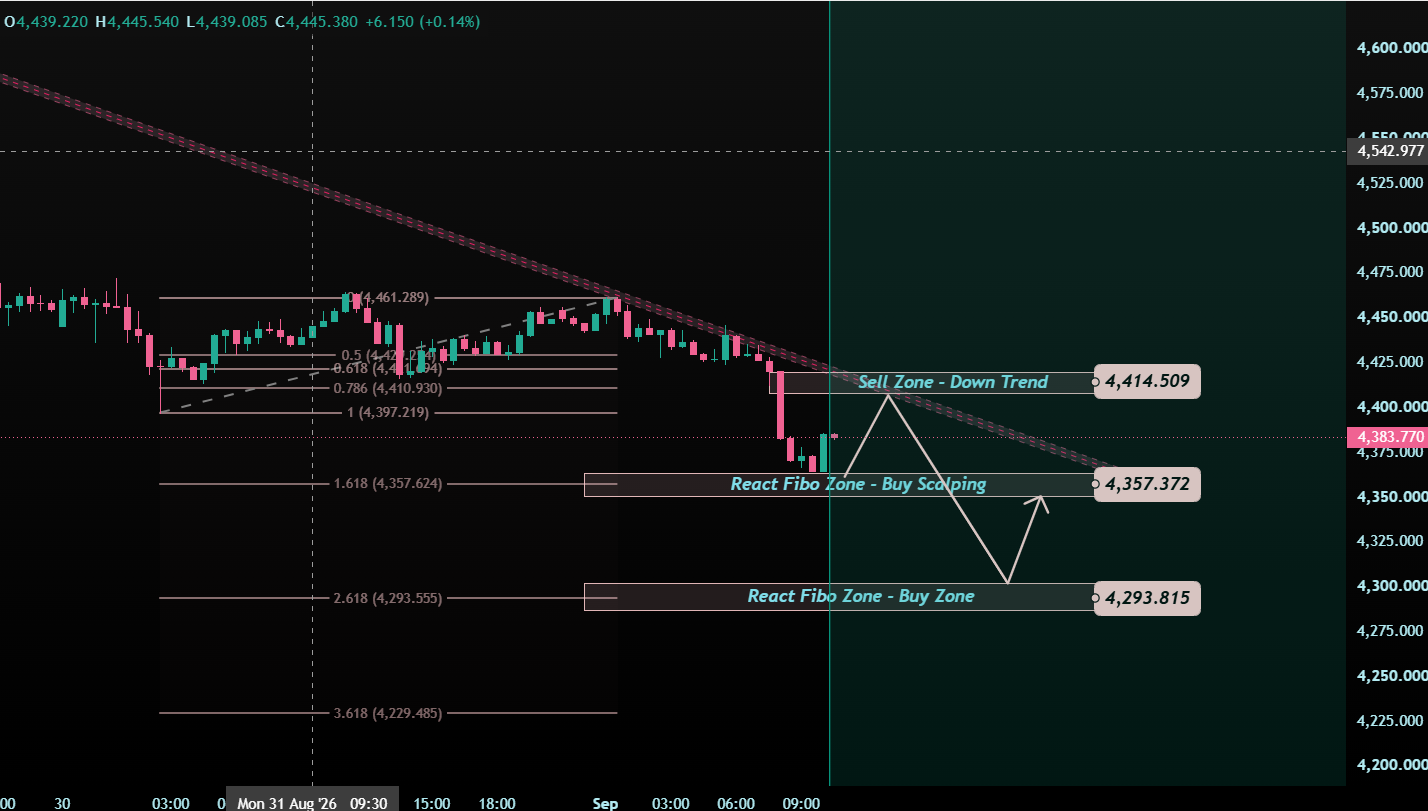
Gold is still moving with bearish pressure after the recent breakdown. Price is now approaching the 4,357 React Fibo / Buy Scalping area, and this is where the chart becomes important.
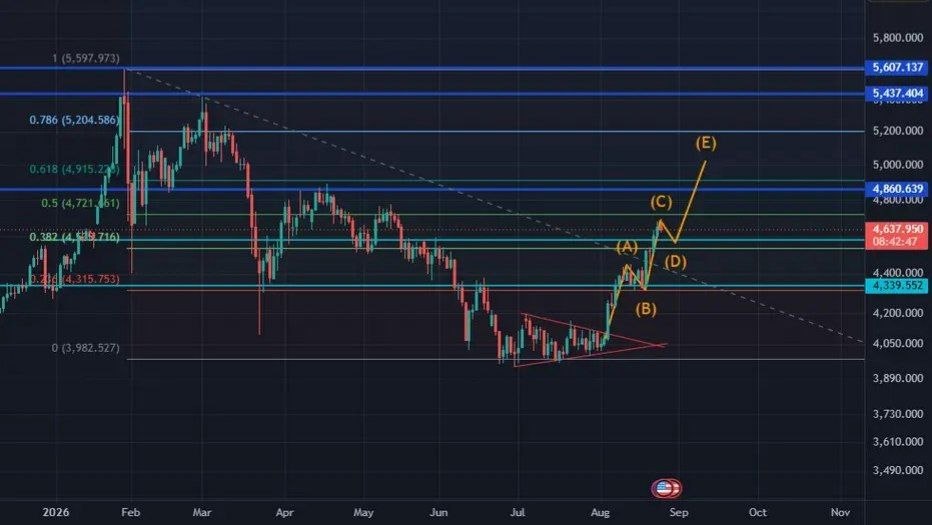
The last wave of gold growth, followed by the start of a 20 to 30 percent correction of the growth amount, and then the start of the next wave of decline in gold.
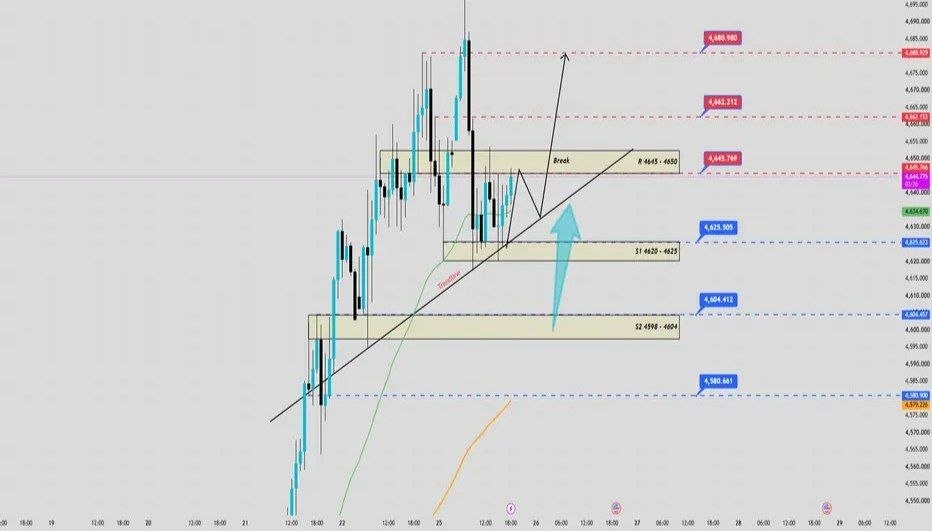
Gold continues to maintain its bullish trend as price remains above key support levels and continues to trade above the rising trendline. The EMA structure also remains bullish, with EMA34 above EMA89. Currently, price is consolidating above the S1 support zone (4620–4625).
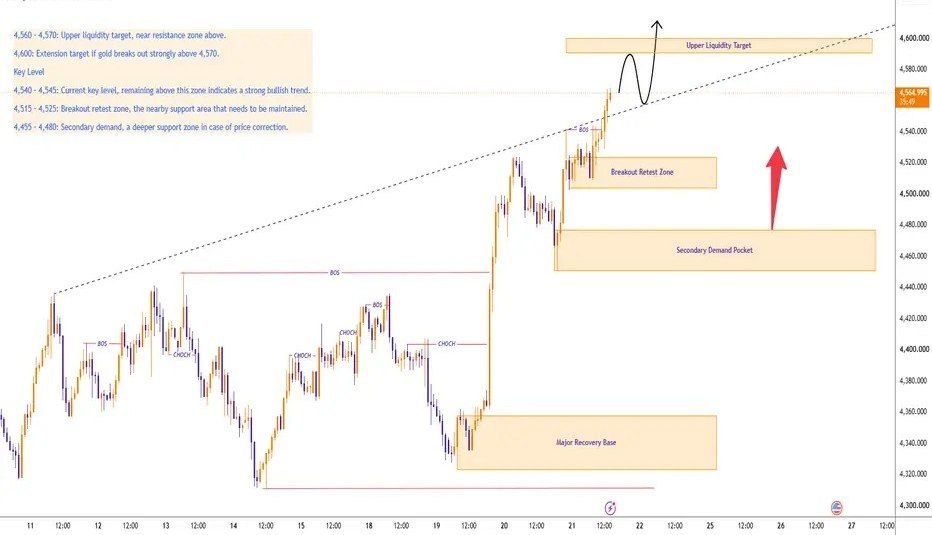
Gold is trading around 4,565 after extending its bullish recovery, supported by continued US Dollar weakness and rising concerns over US debt. This improves gold’s safe-haven appeal and keeps buyers active near the highs.