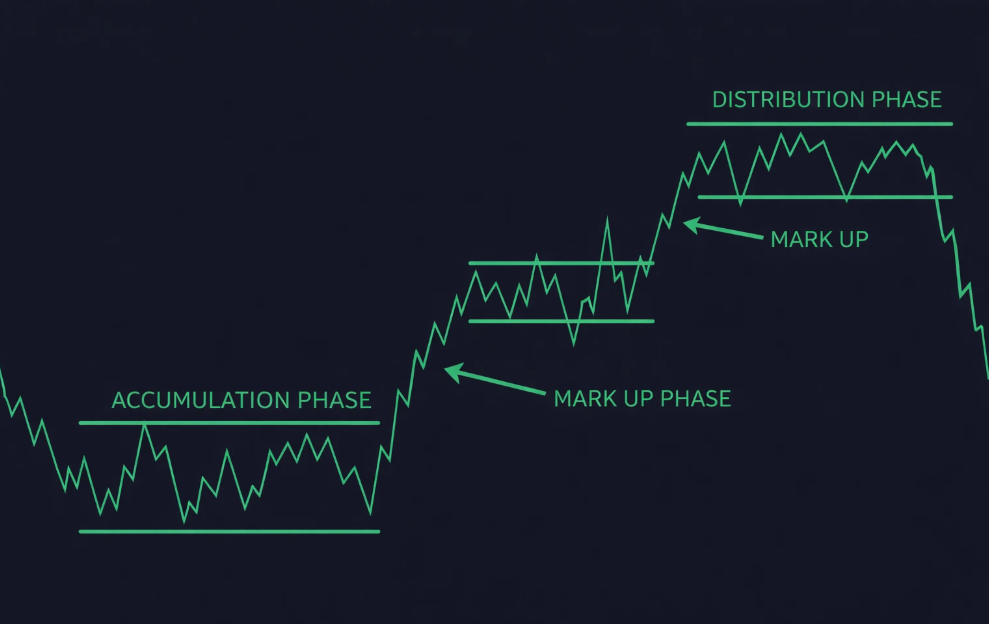
Dow Theory - Use in Technical Analysis, Principal and Definition
Understanding the Market Cycle: Accumulation, Mark Up, Distribution and Mark Down


Understanding the Market Cycle: Accumulation, Mark Up, Distribution and Mark Down
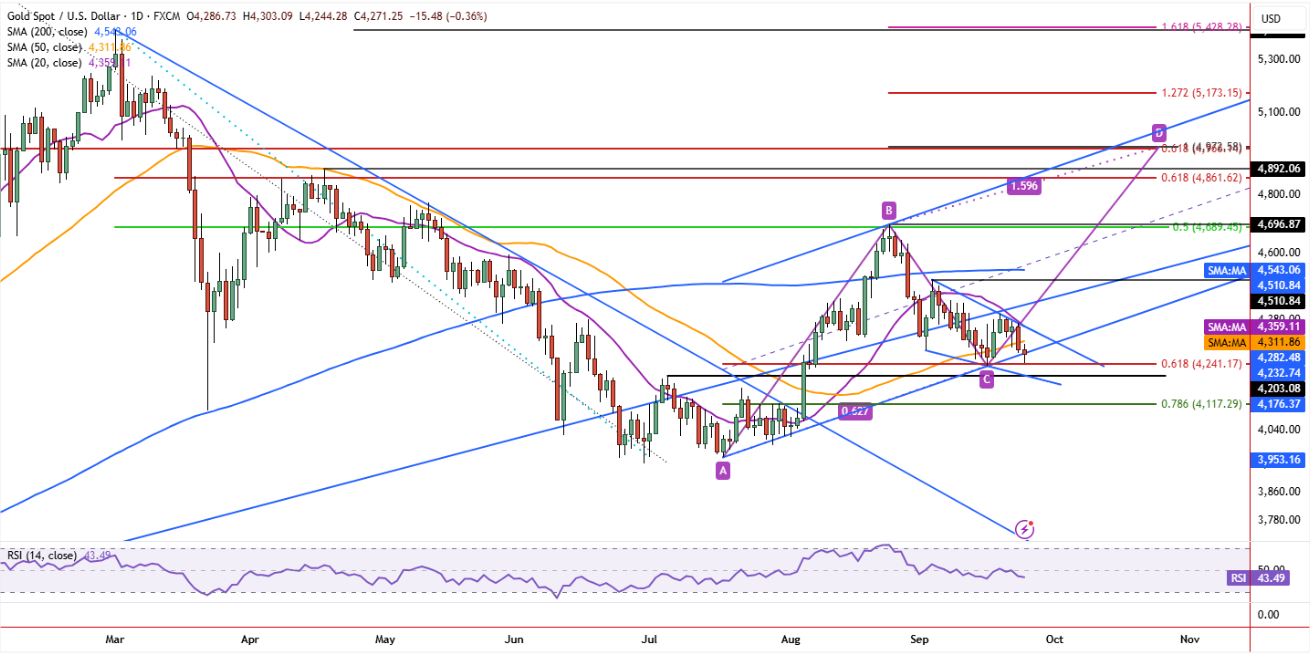
4,040–3,953: A broader support region formed around previous price action and trendline structure.
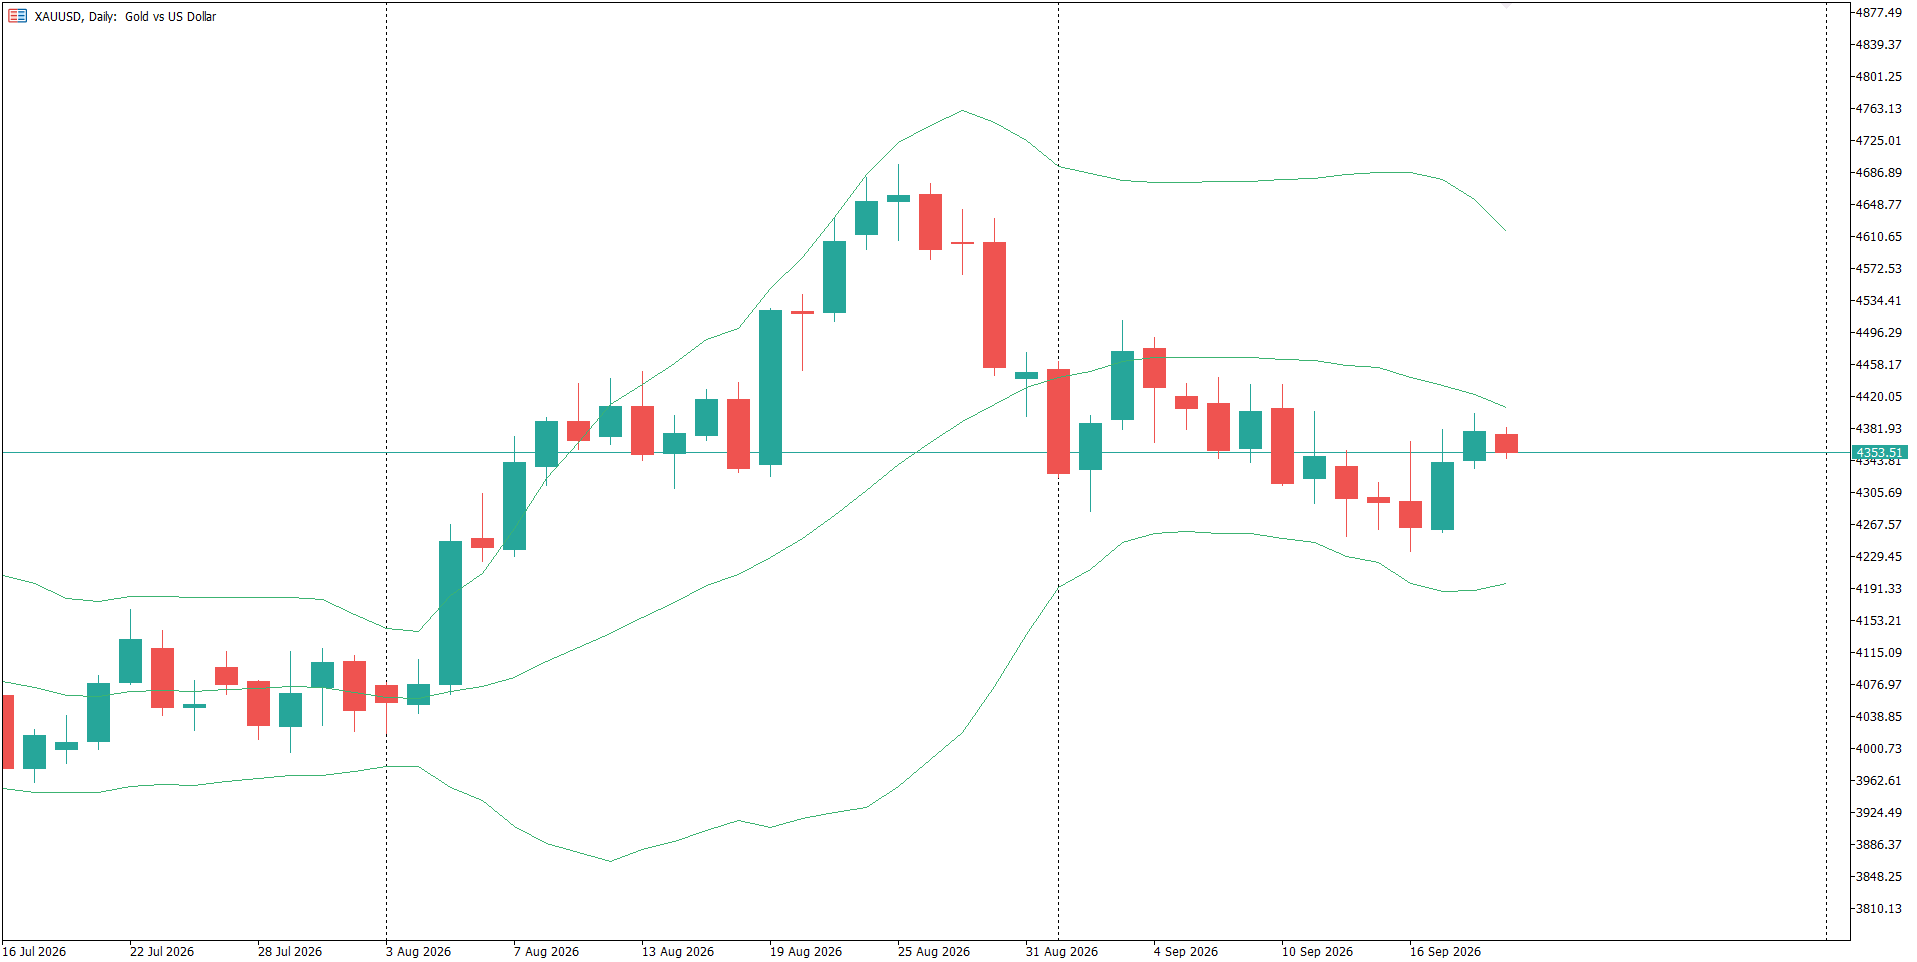
The attached chart shows Gold Futures on the daily timeframe. The chart illustrates a major upward move, followed by a correction and a period of consolidation around the current price region.
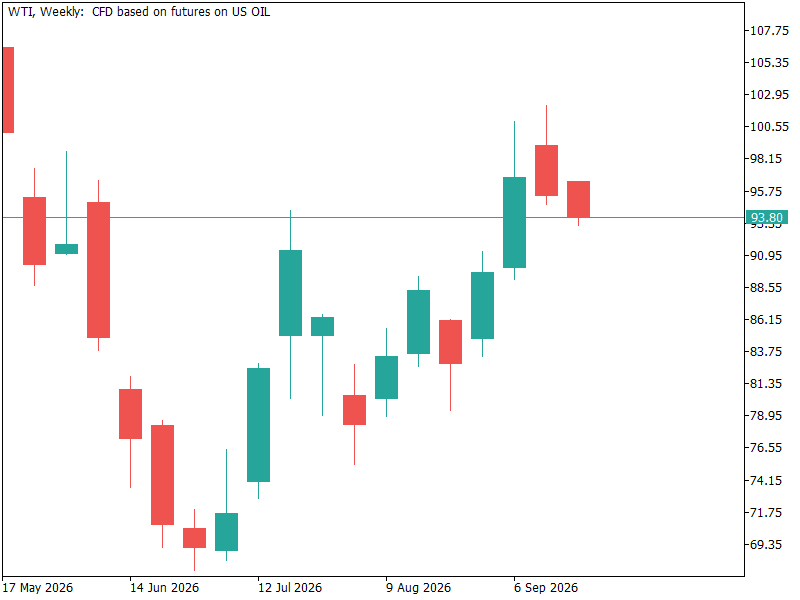
The chart highlights a broad price range with several major swings, followed by a strong recovery from the lower price region.
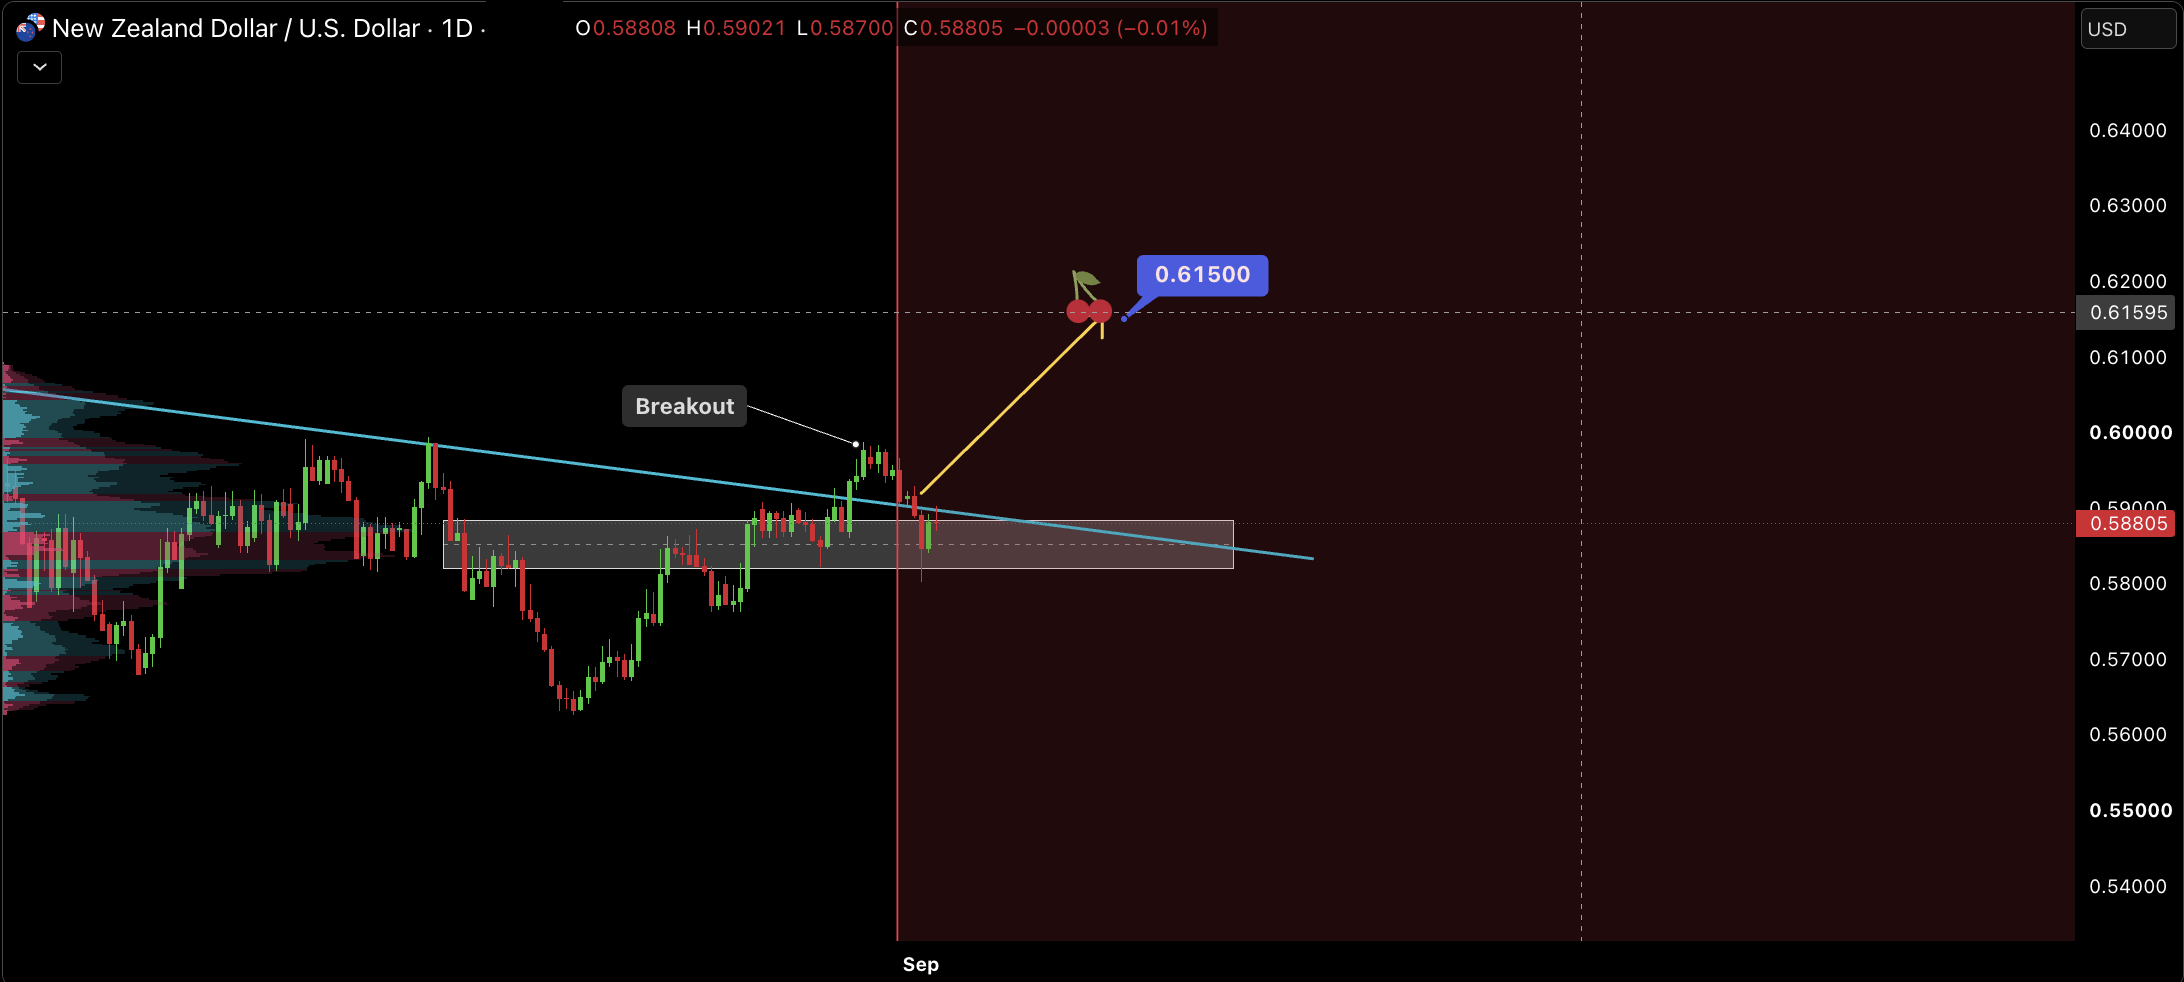
The NZD/USD daily chart shows a potential bullish breakout from a prolonged consolidation structure. Price has moved above the descending trendline, suggesting a possible change in the short-term market structure.
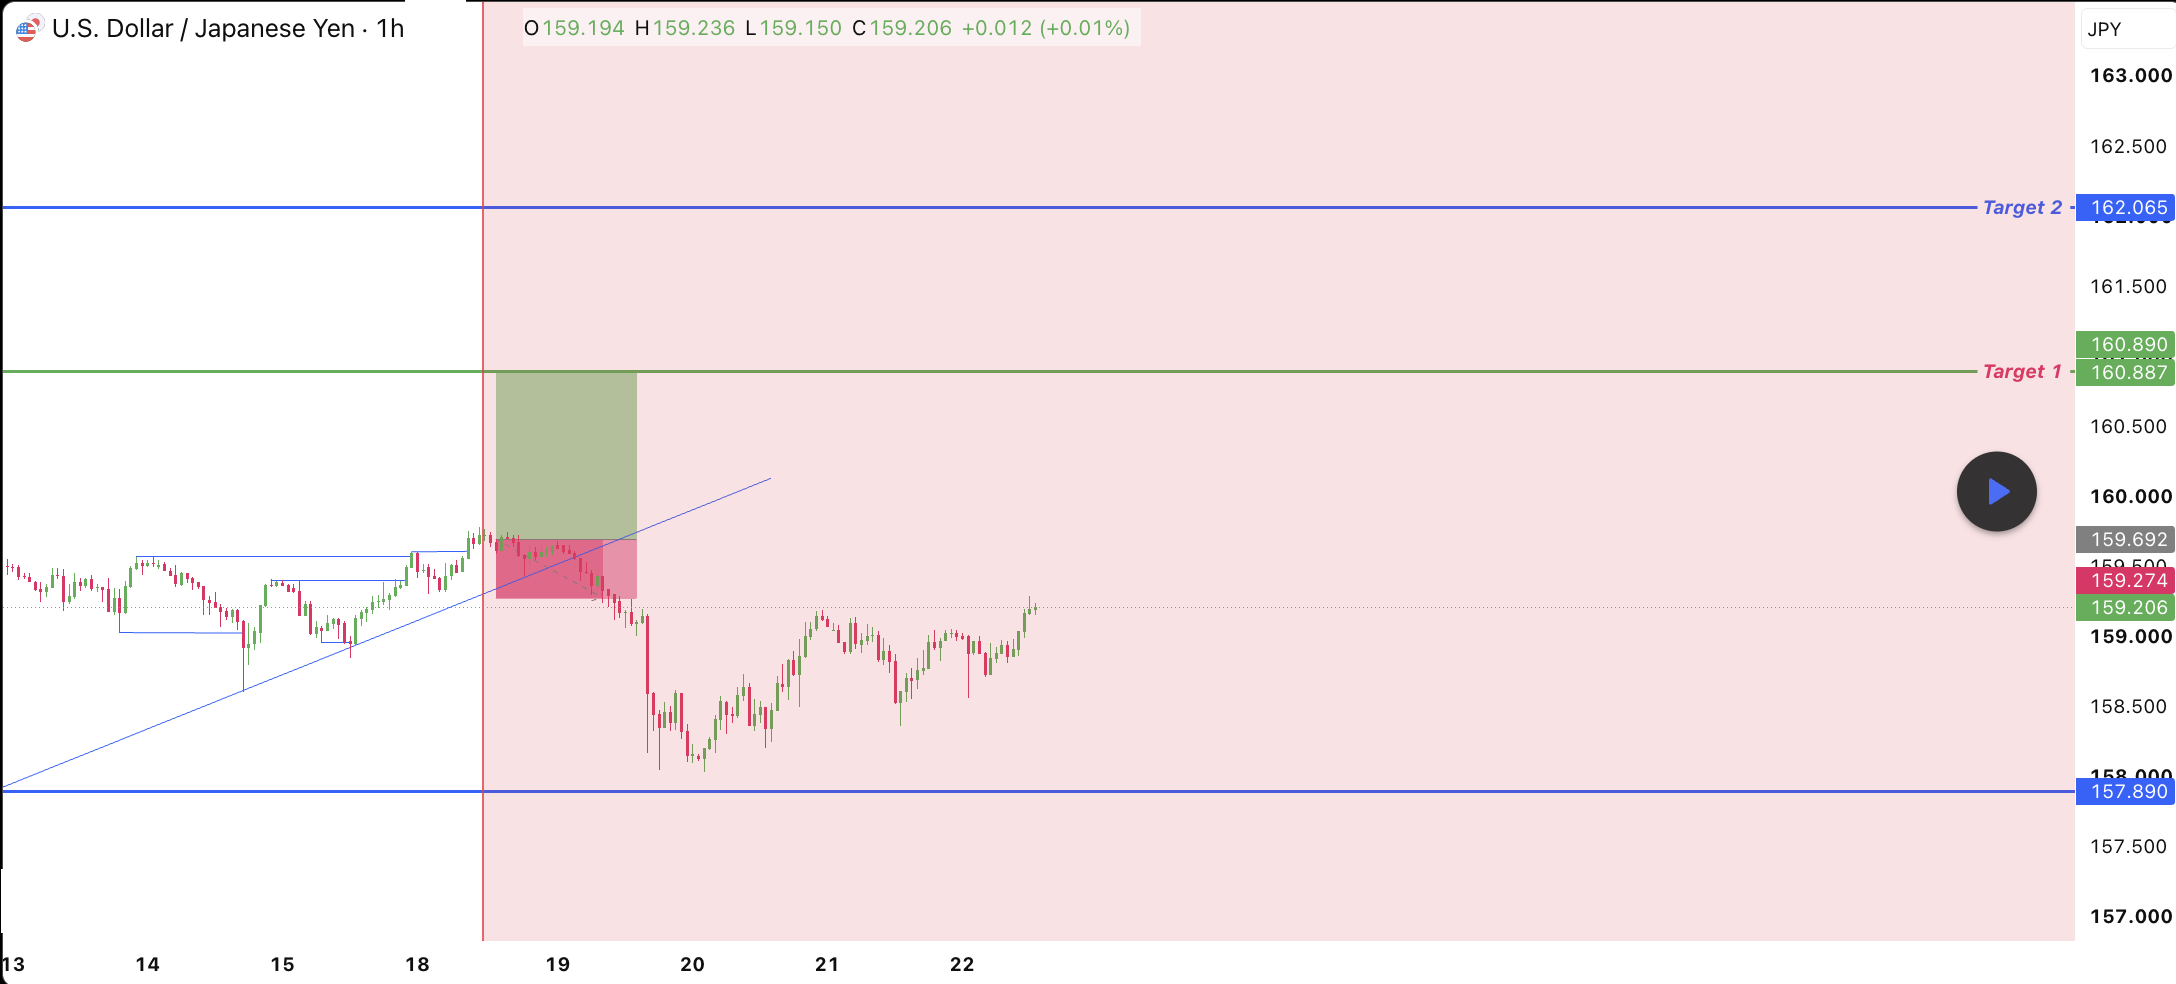
USD/JPY 1-hour chart shows a potential bullish recovery after price moved lower from the previous resistance area. The chart identifies important support and upside target levels that could become relevant if buyers regain control.